Sport pictograms. Olympic Games

The vector stencils library "Landmarks" contains 69 landmark symbols of buildings, waterways, scale and directional indicators for labeling transportation and directional maps, road and route maps, street and transit maps, locator and tourist maps.
The pictograms example "Landmarks - Vector stencils library" was created using the ConceptDraw PRO diagramming and vector drawing software extended with the Directional Maps solution from the Maps area of ConceptDraw Solution Park.
The pictograms example "Landmarks - Vector stencils library" was created using the ConceptDraw PRO diagramming and vector drawing software extended with the Directional Maps solution from the Maps area of ConceptDraw Solution Park.
Viewpoint

North arrow
North arrow
Building

Building

Town house

Suburban home

Skyscraper

Town hall

Public house

Petrol station

Gas station

Factory

School

Warehouse

Hospital

Fire station

Train station

Condos

Barn

Motel

Convenience store

Shopping centre

City

Church

Cathedral

National tail train station

Train railway

Bus stop

Tramlink

Marina / Ferry dock

Car ferry

Stop light
Airport

Airport

Underground / Subway / Metro

Taxi

Bicycle parking

Parking

Fuel / Gas / Petrol

Police

Hospital

Wheelchair access

First aid

Telephone

Post office

Landmarks and museums

University

Shopping

Refreshments / Public House

Restrooms / Toilets

Park

Zoo

Information center

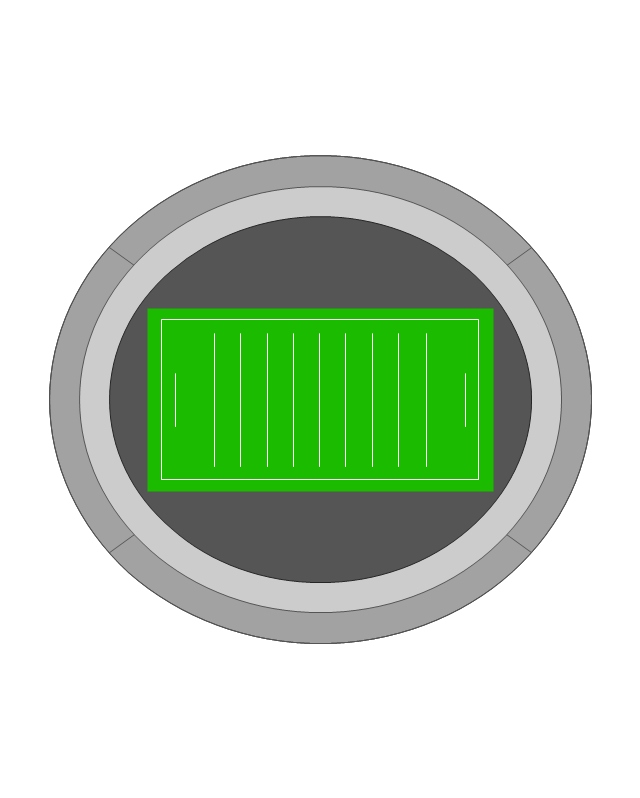
Stadium 1
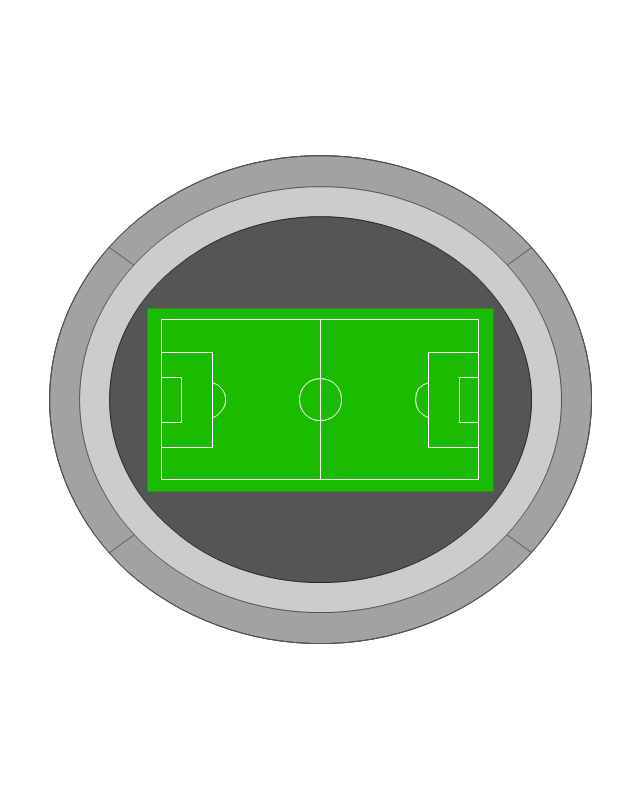
Stadium 2
Park

Tree

Fir-tree

Ocean

Lake

River

Angled river

Forked river

Curved river

Curved river

Flexible river

Bridge

Scale

Design Pictorial Infographics. Design Infographics

Winter Sports Vector Clipart. Medal Map. Spatial Infographics

How to Draw Pictorial Chart. How to Use Infograms

Pictorial Infographics solution contains large number of libraries with variety of predesigned vector pictograms that allows you design infographics in minutes. There are available 10 libraries with 197 vector pictograms.
Cisco People. Cisco icons, shapes, stencils and symbols
")
Vector stencils library "Cisco People" contains 17 pictogram symbols and clipart for drawing the computer network diagrams using the ConceptDraw PRO diagramming and vector drawing software.
Internet Marketing Infographic

Infographic Software

Winter Sports. Olympic Games Illustrations. Medal Summary

Winter Sports. Olympic Games Infographics. Medal Table

Winter Sports. Illustrations and Visualize Statistics

Pictorial Chart

- Winter Sports. Illustrations and Visualize Statistics | Sport pictograms ...
- Office equipment - Vector stencils library | Office pictograms - Vector ...
- How To Draw Building Plans | Store Layout Software | Concept ...
- Building Drawing Software for Design Sport Fields | Sport Field ...
- Building Drawing Software for Design Sport Fields | Building ...
- Site plan | Design elements - Site accessories | Cross-country skiing ...
- Store Layout Software | How To Draw Building Plans | Plumbing and ...
- Building Drawing Software for Design Sport Fields | Interior Design ...
- Sport Field Plans | ConceptDraw Solution Park | Building Drawing ...
- Winter Sports | Building Drawing Software for Design Sport Fields ...
- Building Drawing Software for Design Sport Fields | Interior Design ...
- Building Drawing Software for Design Site Plan | Interior Design Site ...
- Sport Field Plans | Building Drawing Design Element: Sport Fields ...
- Store Layout Software | How To Draw Building Plans | Enterprise ...
- Building Drawing Software for Design Sport Fields | Building ...
- How To Draw Building Plans | Design elements - Location map ...
- Interior Design Office Layout Plan Design Element | Building ...
- Building Plan Software. Building Plan Examples | Floor Plans | How ...
- Physical training - Vector stencils library | Physical training - Vector ...
- Building Drawing Software for Design Sport Fields | Interior Design ...