 Bubble Diagrams
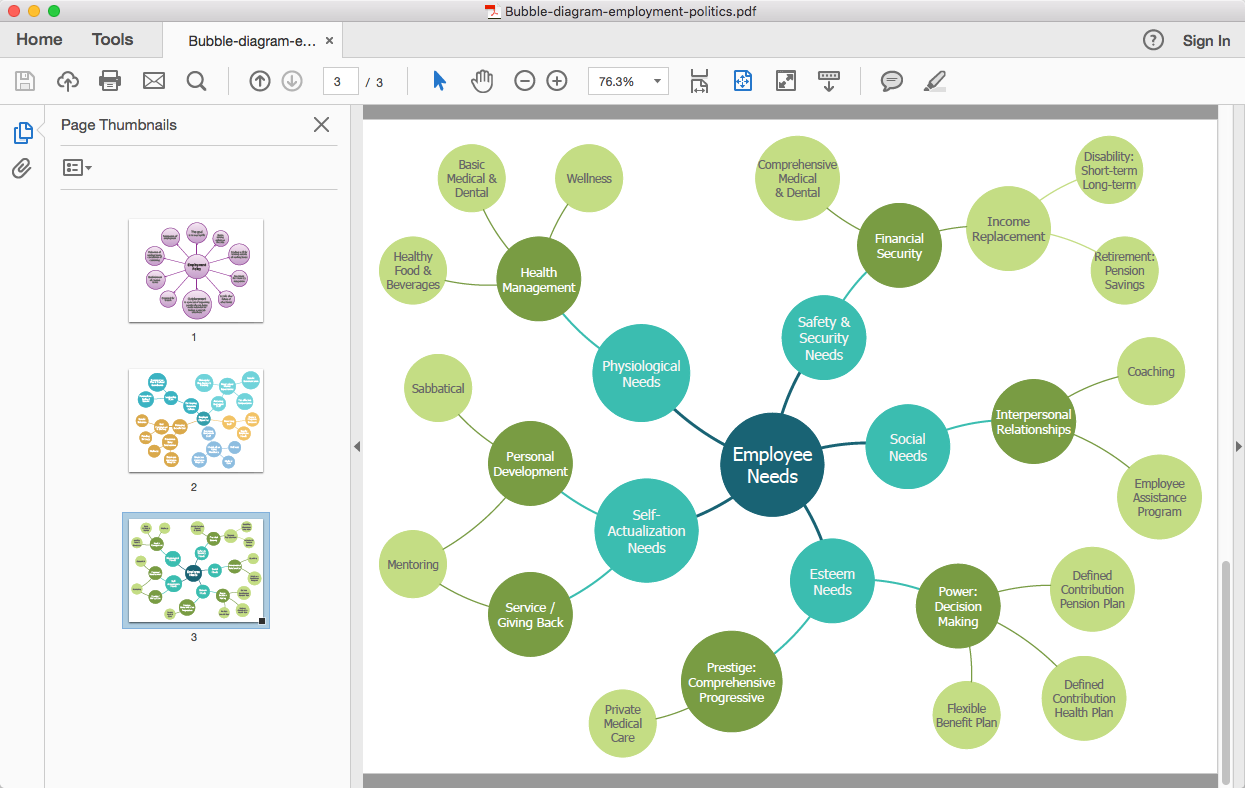
Bubble diagrams have enjoyed great success in software engineering, architecture, economics, medicine, landscape design, scientific and educational process, for ideas organization during brainstorming, for making business illustrations, presentations, planning, design, and strategy development. They are popular because of their simplicity and their powerful visual communication attributes.
Bubble diagrams in Landscape Design with ConceptDraw DIAGRAM

HelpDesk
How to Create a Bubble Diagram

HelpDesk
How To Convert a Bubble Diagram to Adobe PDF
 ConceptDraw Solution Park
ConceptDraw Solution Park collects graphic extensions, examples and learning materials
HelpDesk
How to Add a Bubble Diagram to PowerPoint Presentation

 Computer Network Diagrams
Computer Network Diagrams solution extends ConceptDraw DIAGRAM software with samples, templates and libraries of vector icons and objects of computer network devices and network components to help you create professional-looking Computer Network Diagrams, to plan simple home networks and complex computer network configurations for large buildings, to represent their schemes in a comprehensible graphical view, to document computer networks configurations, to depict the interactions between network's components, the used protocols and topologies, to represent physical and logical network structures, to compare visually different topologies and to depict their combinations, to represent in details the network structure with help of schemes, to study and analyze the network configurations, to communicate effectively to engineers, stakeholders and end-users, to track network working and troubleshoot, if necessary.
HelpDesk
How to Add a Bubble Diagram to MS Word

HelpDesk
How To Create Visio Bubble Chart

 Entity-Relationship Diagram (ERD)
An Entity-Relationship Diagram (ERD) is a visual presentation of entities and relationships. That type of diagrams is often used in the semi-structured or unstructured data in databases and information systems. At first glance ERD is similar to a flowch
 Computer and Networks Area
The solutions from Computer and Networks Area of ConceptDraw Solution Park collect samples, templates and vector stencils libraries for drawing computer and network diagrams, schemes and technical drawings.
 Rack Diagrams
The Rack Diagrams solution, including a vector stencil library, a collection of samples and a quick-start template, can be useful for all who deal with computer networks. Choosing any of the 54 library's vector shapes, you can design various types of Rack diagrams or Server rack diagrams visualizing 19" rack mounted computers and servers.
 Seating Plans
The Seating Plans solution including samples, seating chart templates and libraries of vector design elements assists in creating the Seating plans, Seating arrangement charts, Chair layout designs, Plan drawings of cinema seating, Movie theater chair plans, extensive Cinema theater plans depicting the seating arrangement in the cinema halls, location of closet, cafe and food sale area, in designing the Seating plans for the large seating areas, Seat plan designs for airplanes, trains, etc. Use any of the included samples as the table seating chart template or seating chart template free and achieve professional drawing results in a few minutes.
 Cisco Network Diagrams
Cisco Network Diagrams solution extends ConceptDraw DIAGRAM with the best characteristics of network diagramming software. Included samples, templates and libraries of built-in standardized vector Cisco network icons and Cisco symbols of computers, network devices, network appliances and other Cisco network equipment will help network engineers, network designers, network and system administrators, as well as other IT professionals and corporate IT departments to diagram efficiently the network infrastructure, to visualize computer networks topologies, to design Cisco computer networks, and to create professional-looking Cisco Computer network diagrams, Cisco network designs and schematics, Network maps, and Network topology diagrams in minutes.
 Telecommunication Network Diagrams
Telecommunication Network Diagrams solution extends ConceptDraw DIAGRAM software with samples, templates, and great collection of vector stencils to help the specialists in a field of networks and telecommunications, as well as other users to create Computer systems networking and Telecommunication network diagrams for various fields, to organize the work of call centers, to design the GPRS networks and GPS navigational systems, mobile, satellite and hybrid communication networks, to construct the mobile TV networks and wireless broadband networks.
 Food Court
Use the Food Court solution to create food art. Pictures of food can be designed using libraries of food images, fruit art and pictures of vegetables.
 Network Layout Floor Plans
Network Layout Floor Plans solution extends ConceptDraw DIAGRAM software functionality with powerful tools for quick and efficient documentation the network equipment and displaying its location on the professionally designed Network Layout Floor Plans. Never before creation of Network Layout Floor Plans, Network Communication Plans, Network Topologies Plans and Network Topology Maps was not so easy, convenient and fast as with predesigned templates, samples, examples and comprehensive set of vector design elements included to the Network Layout Floor Plans solution. All listed types of plans will be a good support for the future correct cabling and installation of network equipment.
 Baseball
The Baseball Solution extends ConceptDraw DIAGRAM.5 (or later) software with samples, templates, and libraries of vector objects for drawing baseball diagrams, plays, and illustrations. It can be used to make professional looking documents, presentations,
- How to Create a Bubble Diagram Using ConceptDraw PRO | How to ...
- How to Add a Bubble Diagram to a PowerPoint Presentation Using ...
- Bubble Diagrams | Enterprise Architecture Diagrams | AWS ...
- How To Create a Bubble Chart | How To Make a Bubble Chart | How ...
- Bubble diagrams in Landscape Design with ConceptDraw PRO ...
- Bubble diagrams in Landscape Design with ConceptDraw PRO ...
- Bubble Diagrams | ConceptDraw Solution Park | How to Add a ...
- Bubble diagrams in Landscape Design with ConceptDraw PRO ...
- Landscape architecture with ConceptDraw PRO | Bubble diagrams ...
- How To Make a Bubble Chart | How To Create a Bubble Chart | How ...
- Architectural Bubble Diagram Maker
- Bubble diagrams in Landscape Design with ConceptDraw PRO
- Bubble diagrams with ConceptDraw PRO | Total Quality ...
- Bubble diagrams in Landscape Design with ConceptDraw PRO ...
- Bubble diagrams with ConceptDraw PRO | How To Create a Bubble ...
- AWS Architecture Diagrams | Swim Lane Diagrams | Computer ...
- Seven Management and Planning Tools | Bubble diagrams in ...
- Bubble Diagrams | Language Learning | Interactive Voice Response ...
- How To Create a Bubble Chart | Best Diagramming Software for Mac ...