Export from ConceptDraw DIAGRAM Document to a Graphic File


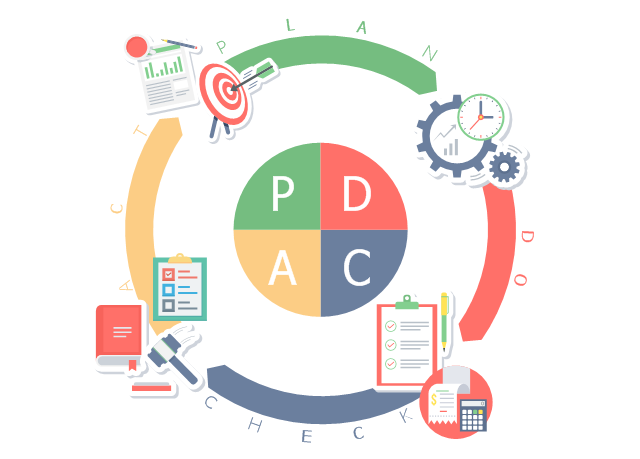
This business infographic sample shows the plan–do–check–act cycle. It was designed on the base of the Wikimedia Commons file: PDCA-Cycle.png.
[commons.wikimedia.org/ wiki/ File:PDCA-Cycle.png]
This file is licensed under the Creative Commons Attribution-Share Alike 3.0 Unported license. [creativecommons.org/ licenses/ by-sa/ 3.0/ deed.en]
"PDCA (plan–do–check–act or plan–do–check–adjust) is an iterative four-step management method used in business for the control and continual improvement of processes and products. It is also known as the Deming circle/ cycle/ wheel, Shewhart cycle, control circle/ cycle, or plan–do–study–act (PDSA)." [PDCA. Wikipedia]
The business infographic example "PDCA cycle" was designed using ConceptDraw PRO diagramming and vector drawing software extended with the Business and Finance solution from Illustration area of ConceptDraw Solution Park.
Infographic
This circle diagram sample was redesigned from the Wikimedia Commons file: Research cycle.png. "Some of the basic elements of the scientific method, arranged in a cycle to emphasize that it is an iterative process." [commons.wikimedia.org/ wiki/ File:Research_ cycle.png]
This file is licensed under the Creative Commons Attribution 2.0 Generic license. [creativecommons.org/ licenses/ by/ 2.0/ deed.en]
"The scientific method is a body of techniques for investigating phenomena, acquiring new knowledge, or correcting and integrating previous knowledge. To be termed scientific, a method of inquiry must be based on empirical and measurable evidence subject to specific principles of reasoning. ...
Four essential elements of the scientific method are iterations, recursions, interleavings, or orderings of the following:
(1) Characterizations (observations, definitions, and measurements of the subject of inquiry).
(2) Hypotheses (theoretical, hypothetical explanations of observations and measurements of the subject).
(3) Predictions (reasoning including logical deduction from the hypothesis or theory).
(4) Experiments (tests of all of the above)...
A linearized, pragmatic scheme of the four points above is sometimes offered as a guideline for proceeding:
(1) Define a question.
(2) Gather information and resources (observe).
(3) Form an explanatory hypothesis.
(4) Test the hypothesis by performing an experiment and collecting data in a reproducible manner.
(5) Analyze the data.
(6) Interpret the data and draw conclusions that serve as a starting point for new hypothesis.
(7) Publish results.
(8) Retest (frequently done by other scientists).
The iterative cycle inherent in this step-by-step method goes from point 3 to 6 back to 3 again." [Scientific method. Wikipedia]
The circle diagram example "Research cycle" was created using the ConceptDraw PRO diagramming and vector drawing software extended with the Target and Circular Diagrams solution from the Marketing area of ConceptDraw Solution Park.
www.conceptdraw.com/ solution-park/ marketing-target-and-circular-diagrams
Circle diagram

This cycle process chart was redesigned from the Wikimedia Commons file: Business Feedback Loop PNG version.png.
"A business ideally is continually seeking feedback from customers: are the products helpful? are their needs being met? Constructive criticism helps marketers adjust offerings to meet customer needs."
[commons.wikimedia.org/ wiki/ File:Business_ Feedback_ Loop_ PNG_ version.png]
The cycle process diagram example "Business feedback loop" was created using the ConceptDraw PRO diagramming and vector drawing software extended with the Sales Flowcharts solution from the Marketing area of ConceptDraw Solution Park.
Customers feedback cycle process chart

Pyramid Diagram

Flowchart design. Flowchart symbols, shapes, stencils and icons


SWOT Matrix Template

This organization chart example was redesigned from the Wikimedia Commons file: US Navy Operating Forces Org Chart.png. [commons.wikimedia.org/ wiki/ File:US_ Navy_ Operating_ Forces_ Org_ Chart.png]
"The operating forces commanders and fleet commanders have a dual chain of command. Administratively, they report to the Chief of Naval Operations and provide, train, and equip naval forces. Operationally, they provide naval forces and report to the appropriate Unified Combatant Commanders. Commander Fleet Forces Command commands and controls fleet assets on both the Atlantic and Pacific coasts for interdeployment training cycle purposes. As units of the Navy enter the area of responsibility for a particular Navy area commander, they are operationally assigned to the appropriate numbered fleet. All Navy units also have an administrative chain of command with the various ships reporting to the appropriate Type Commander." [navy.mil/ navydata/ organization/ orgopfor.asp]
The org chart sample "US Navy operating forces" was created using the ConceptDraw PRO diagramming and vector drawing software extended with the 25 Typical Organizational Charts solution from the Management area of ConceptDraw Solution Park.
Org chart

Pyramid Diagram

How to Create Presentation of Your Project Gantt Chart

Pyramid Diagram

Pyramid Diagram

How To Create Home Plan with Examples


Geo Map - Asia - Papua New Guinea

- Bike Png For Layout
- Bike Straight Bike Png
- Ballet Bar Png
- Bicycle Png
- Paper Clip Cartoon Png
- Bike Outline Plan Png
- An Open Exercise Book Png
- Transport pictograms - Vector stencils library | Motorbike Vector Png
- Bike Rack Plan View Png
- Bike Vector Png
- Bike Floorplan Png
- Treadmill Png
- Minibus Png
- Boat 2d Png
- Cycle Png
- Shapes Stairs Png
- Hydrologic Cycle Png
- Supermarket Png
- Note Pad Exercise Book Png
- Car Isometric View Png File