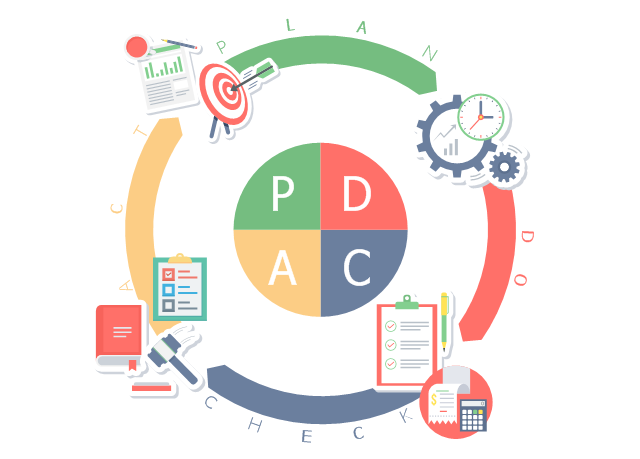
This business infographic sample shows the plan–do–check–act cycle. It was designed on the base of the Wikimedia Commons file: PDCA-Cycle.png.
[commons.wikimedia.org/ wiki/ File:PDCA-Cycle.png]
This file is licensed under the Creative Commons Attribution-Share Alike 3.0 Unported license. [creativecommons.org/ licenses/ by-sa/ 3.0/ deed.en]
"PDCA (plan–do–check–act or plan–do–check–adjust) is an iterative four-step management method used in business for the control and continual improvement of processes and products. It is also known as the Deming circle/ cycle/ wheel, Shewhart cycle, control circle/ cycle, or plan–do–study–act (PDSA)." [PDCA. Wikipedia]
The business infographic example "PDCA cycle" was designed using ConceptDraw PRO diagramming and vector drawing software extended with the Business and Finance solution from Illustration area of ConceptDraw Solution Park.
Infographic
This circle diagram sample was redesigned from the Wikimedia Commons file: Research cycle.png. "Some of the basic elements of the scientific method, arranged in a cycle to emphasize that it is an iterative process." [commons.wikimedia.org/ wiki/ File:Research_ cycle.png]
This file is licensed under the Creative Commons Attribution 2.0 Generic license. [creativecommons.org/ licenses/ by/ 2.0/ deed.en]
"The scientific method is a body of techniques for investigating phenomena, acquiring new knowledge, or correcting and integrating previous knowledge. To be termed scientific, a method of inquiry must be based on empirical and measurable evidence subject to specific principles of reasoning. ...
Four essential elements of the scientific method are iterations, recursions, interleavings, or orderings of the following:
(1) Characterizations (observations, definitions, and measurements of the subject of inquiry).
(2) Hypotheses (theoretical, hypothetical explanations of observations and measurements of the subject).
(3) Predictions (reasoning including logical deduction from the hypothesis or theory).
(4) Experiments (tests of all of the above)...
A linearized, pragmatic scheme of the four points above is sometimes offered as a guideline for proceeding:
(1) Define a question.
(2) Gather information and resources (observe).
(3) Form an explanatory hypothesis.
(4) Test the hypothesis by performing an experiment and collecting data in a reproducible manner.
(5) Analyze the data.
(6) Interpret the data and draw conclusions that serve as a starting point for new hypothesis.
(7) Publish results.
(8) Retest (frequently done by other scientists).
The iterative cycle inherent in this step-by-step method goes from point 3 to 6 back to 3 again." [Scientific method. Wikipedia]
The circle diagram example "Research cycle" was created using the ConceptDraw PRO diagramming and vector drawing software extended with the Target and Circular Diagrams solution from the Marketing area of ConceptDraw Solution Park.
www.conceptdraw.com/ solution-park/ marketing-target-and-circular-diagrams
Circle diagram

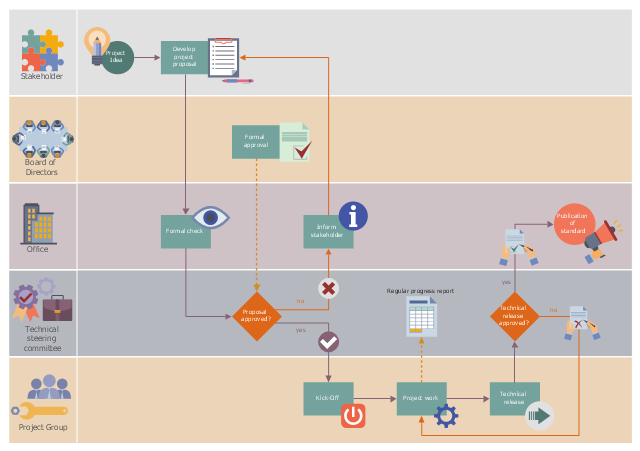
This workflow diagram example was designed on the base of the Wikimedia Commons file: ASAM e.V. flowchart.png.
"Life cycle of an ASAM standard." [commons.wikimedia.org/ wiki/ File:ASAM_ e.V._ flowchart.png]
This file is licensed under the Creative Commons Attribution-Share Alike 3.0 Unported license. [creativecommons.org/ licenses/ by-sa/ 3.0/ deed.en]
"Association for Standardization of Automation and Measuring Systems or ASAM is an incorporated association under German law. Its members are primarily international car manufacturers, suppliers and engineering service providers from the automotive industry. The association coordinates the development of technical standards, which are developed by working groups composed of experts from its member companies. ASAM pursues the vision that the tools of a development process chain can be freely interconnected and allow a seamless exchange of data. The standards define protocols, data models, file formats and application programming interfaces (APIs) for the use in the development and testing of automotive electronic control units." [Association for Standardisation of Automation and Measuring Systems. Wikipedia]
The workflow diagram example "Life cycle of an ASAM standard" was created using ConceptDraw PRO software extended with the Business Process Workflow Diagrams solution from the Business Processes area of ConceptDraw Solution Park.
Workflow diagram
This cycle process chart was redesigned from the Wikimedia Commons file: Business Feedback Loop PNG version.png.
"A business ideally is continually seeking feedback from customers: are the products helpful? are their needs being met? Constructive criticism helps marketers adjust offerings to meet customer needs."
[commons.wikimedia.org/ wiki/ File:Business_ Feedback_ Loop_ PNG_ version.png]
The cycle process diagram example "Business feedback loop" was created using the ConceptDraw PRO diagramming and vector drawing software extended with the Sales Flowcharts solution from the Marketing area of ConceptDraw Solution Park.
Customers feedback cycle process chart

Process Flowchart


Flowchart design. Flowchart symbols, shapes, stencils and icons


What is the Accounting Cycle?

Steps of Accounting Cycle

This circular arrows diagram sample shows business process management life cycle.
It was designed on the base of the Wikimedia Commons file: Business Process Management Life-Cycle.svg. [commons.wikimedia.org/ wiki/ File:Business_ Process_ Management_ Life-Cycle.svg]
This file is licensed under the Creative Commons Attribution-Share Alike 3.0 Unported license. [creativecommons.org/ licenses/ by-sa/ 3.0/ deed.en]
"BPM life-cycle.
Business process management activities can be grouped into six categories: vision, design, modeling, execution, monitoring, and optimization.
Functions are designed around the strategic vision and goals of an organization. Each function is attached with a list of processes. Each functional head in an organization is responsible for certain sets of processes made up of tasks which are to be executed and reported as planned. Multiple processes are aggregated to function accomplishments and multiple functions are aggregated to achieve organizational goals." [Business process management. Wikipedia]
The arrow donut chart example "BPM life cycle" was created using the ConceptDraw PRO diagramming and vector drawing software extended with the Circular Arrows Diagrams solution from the area "What is a Diagram" of ConceptDraw Solution Park.
Circular arrows diagram

This arrow loop cycle diagram sample was created on the base of the figure illustrating the webpage "Exploratory Advanced Research Program Hand-Off Workshops" from the US Department of Transportation - Federal Highway Administration (FHWA) website. "The FHWA’s research and technology innovation life cycle illustrates that research and technology development are not insular activities, but integrated processes that together constitute a system.
Following general workshop discussion, a number of common issues emerged among the groups. These centered around the research life cycle, communicating the value of exploratory advanced research, and continued project funding. It was felt that there is a general need to better describe the research and deployment cycle specific to highway transportation and possibly to highway research fields, such as materials or system planning. Research life cycle diagrams show a very linear, chronological process but it is not necessarily that way in reality." [fhwa.dot.gov/ advancedresearch/ pubs/ 11034/ ]
The arrow loop diagram example "Innovation life cycle" was created using the ConceptDraw PRO diagramming and vector drawing software extended with the Target and Circular Diagrams solution from the Marketing area of ConceptDraw Solution Park.
www.conceptdraw.com/ solution-park/ marketing-target-and-circular-diagrams
Arrow loop cycle diagram
This circular arrows diagram sample depicts the Plan–Do–Check–Act cycle.
"PDCA (plan–do–check–act or plan–do–check–adjust) is an iterative four-step management method used in business for the control and continuous improvement of processes and products. It is also known as the Deming circle/ cycle/ wheel, Shewhart cycle, control circle/ cycle, or plan–do–study–act (PDSA). Another version of this PDCA cycle is OPDCA. The added "O" stands for observation or as some versions say "Grasp the current condition." This emphasis on observation and current condition has currency with Lean manufacturing/ Toyota Production System literature." [PDCA. Wikipedia]
The diagram example "PDCA cycle" was created using the ConceptDraw PRO diagramming and vector drawing software extended with the Circular Arrows Diagrams solution from the area "What is a Diagram" of ConceptDraw Solution Park.
Circular arrows diagram

The vector stencils library "Citric acid cycle (TCA cycle)" contains 26 symbols of metabolites for drawing metabolic pathway maps and biochemical shematic diagrams of the citric acid cycle (TCA cycle, tricarboxylic acid cycle, Krebs cycle) and diagrams of metabolism processes.
"The citric acid cycle - also known as the tricarboxylic acid cycle (TCA cycle), or the Krebs cycle, - is a series of chemical reactions used by all aerobic organisms to generate energy through the oxidation of acetate derived from carbohydrates, fats and proteins into carbon dioxide and chemical energy in the form of adenosine triphosphate (ATP). In addition, the cycle provides precursors of certain amino acids as well as the reducing agent NADH that is used in numerous other biochemical reactions. Its central importance to many biochemical pathways suggests that it was one of the earliest established components of cellular metabolism and may have originated abiogenically.
The name of this metabolic pathway is derived from citric acid (a type of tricarboxylic acid) that is consumed and then regenerated by this sequence of reactions to complete the cycle. In addition, the cycle consumes acetate (in the form of acetyl-CoA) and water, reduces NAD+ to NADH, and produces carbon dioxide as a waste byproduct. The NADH generated by the TCA cycle is fed into the oxidative phosphorylation (electron transport) pathway. The net result of these two closely linked pathways is the oxidation of nutrients to produce usable chemical energy in the form of ATP." [Citric acid cycle. Wikipedia]
The shapes example "Design elements - TCA cycle" is included in the Biology solution from the Science and Education area of ConceptDraw Solution Park.
Tricarboxylic acid cycle (Krebs cycle) symbols
-symbols--design-elements---tca-cycle.png--diagram-flowchart-example.png)
The cycle diagram sample was created on the base of the figure illustrating the webpage "2. POLICY & STRATEGY" of "Scottish Police College Primary Inspection 2006: A Report by Her Majesty's Inspectorate of Constabulary" from the Scottish Government website.
"Strategic Planning.
2.1 The planning process for the College currently follows a structured approach, starting in April and extending through the financial year. The planning cycle is illustrated in figure 2. ...
2.2 The College recognises the need to consult with its customers and stakeholders in the process of setting objectives and directing the training programme. The planning cycle to date refers to force visits, environmental scanning, the course planning process which involves consultation with all forces and other common police services, as well as to a survey of external providers.
2.3 The information from consultation feeds into an EFQM framework from which the College has identified four key policies, namely:
(1) developing and delivering quality training;
(2) developing our people through lifelong learning;
(3) continuous improvement of our service; and
(4) embracing the changing environment.
2.4 The objectives set at divisional level are designed to contribute to delivering these policies. HMIC found that whilst the selected objectives were presented in line with the structure, not all could be considered to meet SMART (Specific, Measurable, Achievable, Relevant and Timed) criteria. This failure indicates that while the process appears suitably structured to deliver a robust result, some of those involved could perhaps have a better understanding of the process." [scotland.gov.uk/ Publications/ 2007/ 02/ 15134652/ 8]
The cycle diagram example "Strategic planning" was created using the ConceptDraw PRO diagramming and vector drawing software extended with the Target and Circular Diagrams solution from the Marketing area of ConceptDraw Solution Park.
www.conceptdraw.com/ solution-park/ marketing-target-and-circular-diagrams
Cycle diagram

This arrow ring chart sample was created on the base of the figure illustrating the webpage "National Preparedness Cycle. Plan" from the Federal Emergency Management Agency (FEMA) website. "Planning makes it possible to manage the entire life cycle of a potential crisis. Strategic and operational planning establishes priorities, identifies expected levels of performance and capability requirements, provides the standard for assessing capabilities and helps stakeholders learn their roles. The planning elements identify what an organization’s Standard Operating Procedures (SOPs) or Emergency Operations Plans (EOPs) should include for ensuring that contingencies are in place for delivering the capability during a large-scale disaster." [fema.gov/ plan]
The arrow ring chart example "National Preparedness Cycle" was created using the ConceptDraw PRO diagramming and vector drawing software extended with the Target and Circular Diagrams solution from the Marketing area of ConceptDraw Solution Park.
www.conceptdraw.com/ solution-park/ marketing-target-and-circular-diagrams
Arrow ring chart
This Water cycle diagram example was drawn using the ConceptDraw PRO diagramming and vector graphics software extended with the clipart libraries Geography and Weather.
"The water cycle, also known as the hydrologic cycle or the H2O cycle, describes the continuous movement of water on, above and below the surface of the Earth. The mass water on Earth remains fairly constant over time but the partitioning of the water into the major reservoirs of ice, fresh water, saline water and atmospheric water is variable depending on a wide range of climatic variables. The water moves from one reservoir to another, such as from river to ocean, or from the ocean to the atmosphere, by the physical processes of evaporation, condensation, precipitation, infiltration, runoff, and subsurface flow. In so doing, the water goes through different phases: liquid, solid (ice), and gas (vapor)." [Water cycle. Wikipedia]
This water cycle diagram example is included in the Nature solution from the Illustration area of ConceptDraw Solution Park.
Vector illustration

- Circular arrows diagram - PDCA cycle | Circular Arrow | Circular ...
- Arrow Cycle Png
- Cycle Process Png
- Research cycle - Circle diagram | Export from ConceptDraw PRO ...
- Hydrologic Cycle Png
- Water cycle diagram | Sea Water Vapor Png Clipart
- Water cycle diagram | Weather - Vector stencils library | Rain And ...
- Research cycle - Circle diagram | Political map of Central America ...
- Research cycle - Circle diagram | 3 Circle Venn Diagram. Venn ...
- Life Cycle Round Png
- Elements location of a welding symbol | Research cycle - Circle ...
- Png Image Of A Cycle
- Research cycle - Circle diagram | DroidDia PRO unlocker | Porter ...
- Cycle Arrows Png
- Research cycle - Circle diagram | U.S. Medicare spending per capita ...
- Cycle Png Blue
- Geography - Vector stencils library | Water cycle diagram | Flat ...
- National Preparedness Cycle - Arrow ring chart | Circular diagrams ...
- Research cycle - Circle diagram | Process Flowchart - Draw Process ...
- Research cycle - Circle diagram | Circular diagrams - Vector stencils ...