Database Flowchart Symbols

Basic Flowchart Symbols and Meaning


Electrical Symbols — Transistors
Entity Relationship Diagram Symbols

The vector stencils library "Sales symbols" contains 55 sales pictograms.
Use these icon set to draw your sales flowcharts, workflow diagrams and process charts with the ConceptDraw PRO diagramming and vector drawing software.
The vector stencils library "Sales symbols" is included in the Sales Flowcharts solution from the Marketing area of ConceptDraw Solution Park.
Use these icon set to draw your sales flowcharts, workflow diagrams and process charts with the ConceptDraw PRO diagramming and vector drawing software.
The vector stencils library "Sales symbols" is included in the Sales Flowcharts solution from the Marketing area of ConceptDraw Solution Park.
Banknotes

Box

Businessman

Businesswoman

Cellphone caller, man

Cellphone caller, woman

Clerk, man

Clerk, woman

Client computer

Cloud

Coins

Computer monitor

Crate

Credit cards

Credit card American Express

Credit card China UnionPay

Credit card Discover

Credit card Master

Credit card Visa

Customer, man

Customer, woman

Data base

Disqualified

Document

Documents

Document folder

Email

Exporting

Man figure

Woman figure

Folder closed

Folder opened

Importing

International

Mail

Mobile

Notes

PayPal

Phone

Phone caller, man

Phone caller, woman

Presentation slide

Qualified

Server

Shopping bag, empty

Shopping bag, full

Shopping cart, empty

Shopping cart, full

Spreadsheet

Technician

Time

USB flash card

User

Web form

Web page

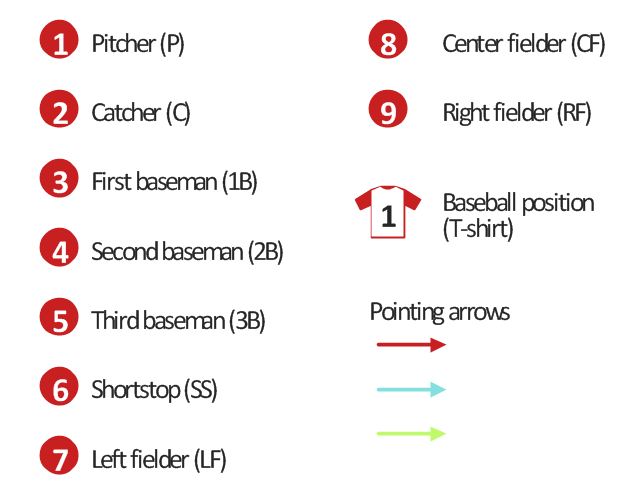
The vector stencils library "Baseball positions" contains 13 symbols: pitcher, catcher, first baseman, second baseman, third baseman, shortstop, left fielder, center fielder, right fielder, baseball position, pointing arrows.
"Baseball is unlike most other competitive sports in that the defense is given control of the ball. Additionally, the number of players on the field at any given time is lopsided in favor of the defense which always has nine players on the field; the offense has between one and four. ...
Each play starts with the ball in the hands of the pitcher, whose job as a member of the defense is to use his skills to somehow prevent the batter from reaching base. The pitcher throws the ball toward the catcher, whose must catch the pitched ball if it is not hit by the batter. In each half-inning, the defense attempts to force three outs.
There are three basic ways in which an out can occur: 1.) If three strikes are recorded against the batter, 2.) if a ball hit by a batter is caught by a defensive player before it hits the ground, or 3.) if a runner who is between bases or has not reached a base to which he is forced is put out by a defensive player in possession of the ball.
If the batter manages to hit the ball, all nine defensive players become active and use the ball in attempting to prevent the batter from reaching base and runners already on base from advancing or scoring. while the offense is busy attempting to move runners around the baseball diamond toward home plate, the defense uses the ball in various ways to achieve outs.
If the defense forces three outs, their team is moved into the offensive role. The exception is if it is the ninth or an extra inning and they are ahead, in which case, the game ends and the defensive team wins." [Defense (sports). Wikipedia]
The symbols example "Design elements - Baseball positions" was created using the ConceptDraw PRO diagramming and vector drawing software extended with the Baseball solution from the Sport area of ConceptDraw Solution Park.
Baseball positions diagram symbols
Data Flow Diagram Symbols. DFD Library

IDEF0 Flowchart Symbols

ERD Symbols and Meanings


Flowchart Software

- Entity Relationship Diagram Symbols | Database Flowchart Symbols ...
- The Specific Flowchart Symbols Data Base
- Flowchart Base On Symbols
- Basic Flowchart Symbols and Meaning | Types of Flowcharts ...
- Floor Plan Base Hot Water Heater Symbols
- Visio Base Transceiver Station
- Design elements - ER diagram (Chen notation) | Crow's foot ERD ...
- Data Base Symbols
- IDEF0 Flowchart Symbols | Basic Flowchart Symbols and Meaning ...