 Bar Graphs
Bar graphs solution extends ConceptDraw PRO software with templates, samples and library of vector stencils for drawing the bar charts.
Sales Growth. Bar Graphs Example

Bar Graph

Bar Chart Examples

HelpDesk
How to Create a Bar Chart in ConceptDraw PRO

Bar charts are widely used to show and compare the values of the same parameters for different data groups.
The bar graph can be vertical or horizontal. This depends on the amount of categories. There are many methods in which bar graph can be built and this makes it a very often used chart type. Usually, a bar chart is created so that the bars are placed vertically. Such arrangement means that the bar's height value is proportional to the category value. Nevertheless, a bar chart can be also drawn horizontally. This means that the longer the bar, the bigger the category. Thus, a bar chart is a good way to present the relative values of different measured items. The ConceptDraw Bar Graphs solution allows you to draw a bar chart quickly using a vector library, containing the set of various bar charts objects.
Bar Chart

Bar Diagrams for Problem Solving. Create manufacturing and economics bar charts with Bar Graphs Solution

Bar Chart Software

Bar Diagrams for Problem Solving. Create space science bar charts with Bar Graphs Solution

Create bar graphs for visual solving your scientific problems and data comparison using the ConceptDraw PRO diagramming and vector drawing software extended with the Bar Graphs Solution from the Graphs and Charts area of ConceptDraw Solition Park.
Chart Maker for Presentations

Rainfall Bar Chart

This sample was created in ConceptDraw PRO diagramming and vector drawing software using the Bar Graphs Solution from the Graphs and Charts area of ConceptDraw Solution Park.
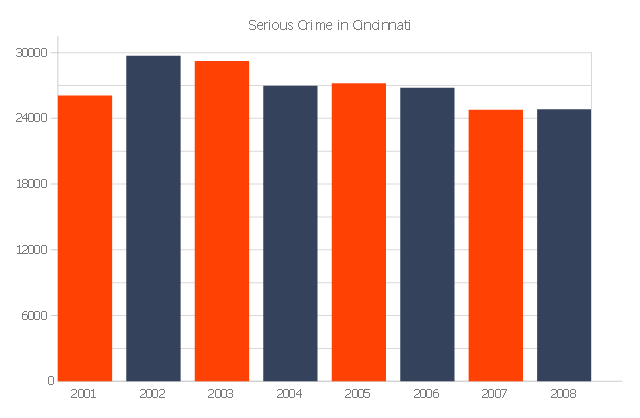
The bar graph example "Serious Crime in Cincinnati" was redesigned from the Commons Wikimedia file: Cincinnati-Part-1-Crimes.jpg.
[commons.wikimedia.org/ wiki/ File:Cincinnati-Part-1-Crimes.jpg]
"Before the riot of 2001, Cincinnati's overall crime rate was dropping dramatically and had reached its lowest point since 1992. After the riot violent crime increased. Reflecting national trends, crime rates in Cincinnati have dropped in all categories from 2006 to 2010." [Crime in Cincinnati. Wikipedia]
The bar graph example "Serious Crime in Cincinnati" was created using the ConceptDraw PRO diagramming and vector drawing software extended with the Bar Graphs solution from the Graphs and Charts area of ConceptDraw Solution Park.
www.conceptdraw.com/ solution-park/ charts-bar-graphs
Column graph
Bar Diagrams for Problem Solving. Create business management bar charts with Bar Graphs Solution

Column Chart Software

Bar Chart Template for Word

You can quickly rework these bar graph templates into your own charts by simply changing displayed data, title and legend texts.
- Bar Graph Complete Solution
- Bar Graphs | Sales Growth. Bar Graphs Example | Bar Graph | A ...
- Bar Graphs | Line Graphs | Picture Graphs | Graphs
- Sales Growth. Bar Graphs Example | Bar Chart Examples | Bar ...
- Bar Graphs
- Winter Sports | Sport Field Plans | ConceptDraw Solution Park | Bar ...
- Example Of Solution Of Bar Chart
- Bar Chart Examples | Bar Diagrams for Problem Solving. Create ...
- Bar Graphs | ConceptDraw Solution Park | Picture Graphs | Top ...
- Bar Graphs | Sales Growth. Bar Graphs Example | How to Create a ...
- Solution Of Bar Chart With Examples
- Bar Graphs | Bar Diagrams for Problem Solving. Create event ...
- Bar Graph
- Simple Bar Graphs
- Bar Chart Template
- Bar Graphs | How to Create Management Infographics Using ...
- Bar Graphs | Double bar graph - Template | Nitrate concentration in ...
- Barrie population - Picture bar graph | Picture graphs - Vector ...
- Sales Growth. Bar Graphs Example | Sales Flowcharts ...
- Pyramid Diagram and Pyramid Chart | Bar Chart Software | Chart ...