 Bar Graphs
The Bar Graphs solution enhances ConceptDraw PRO v10 functionality with templates, numerous professional-looking samples, and a library of vector stencils for drawing different types of Bar Graphs, such as Simple Bar Graph, Double Bar Graph, Divided Bar Graph, Horizontal Bar Graph, Vertical Bar Graph, and Column Bar Chart.
Sales Growth. Bar Graphs Example

Bar Diagram Math

 Divided Bar Diagrams
The Divided Bar Diagrams Solution extends the capabilities of ConceptDraw PRO v10 with templates, samples, and a library of vector stencils for drawing high impact and professional Divided Bar Diagrams and Graphs, Bar Diagram Math, and Stacked Graph.
Bar Diagrams for Problem Solving. Create event management bar charts with Bar Graphs Solution

Bar Chart Examples

Bar Graph

Bar Diagrams for Problem Solving. Create business management bar charts with Bar Graphs Solution

Bar Diagrams for Problem Solving. Create manufacturing and economics bar charts with Bar Graphs Solution

Bar Diagrams for Problem Solving. Create space science bar charts with Bar Graphs Solution

Create bar graphs for visual solving your scientific problems and data comparison using the ConceptDraw PRO diagramming and vector drawing software extended with the Bar Graphs Solution from the Graphs and Charts area of ConceptDraw Solition Park.
Bar Diagrams for Problem Solving. Create economics and financial bar charts with Bar Graphs Solution

Financial Comparison Chart

Bar Charts

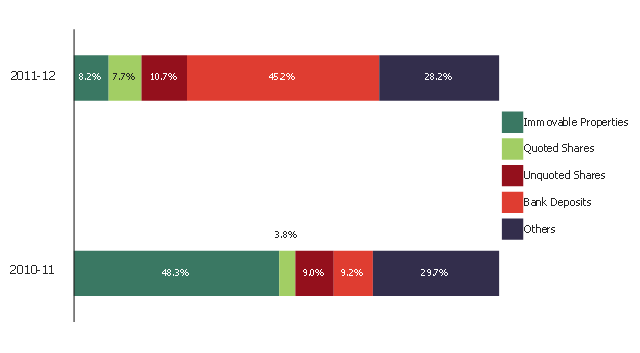
This example was created on the base of the figure "Composition of estates" from the website of the Inland Revenue Department of the Government of the Hong Kong Special Administrative Region.
[ird.gov.hk/ dar/ 2011-12/ en/ assessing.html]
"An estate is the net worth of a person at any point in time alive or dead. It is the sum of a person's assets - legal rights, interests and entitlements to property of any kind - less all liabilities at that time. The issue is of special legal significance on a question of bankruptcy and death of the person.
Depending on the particular context, the term is also used in reference to an estate in land or of a particular kind of property (such as real estate or personal estate). The term is also used to refer to the sum of a person's assets only." [Estate (law). Wikipedia]
The divided bar diagram example "Composition of estates" was created using the ConceptDraw PRO diagramming and vector drawing software extended with the Divided Bar Diagrams solution from the Graphs and Charts area of ConceptDraw Solution Park.
Divided bar chart
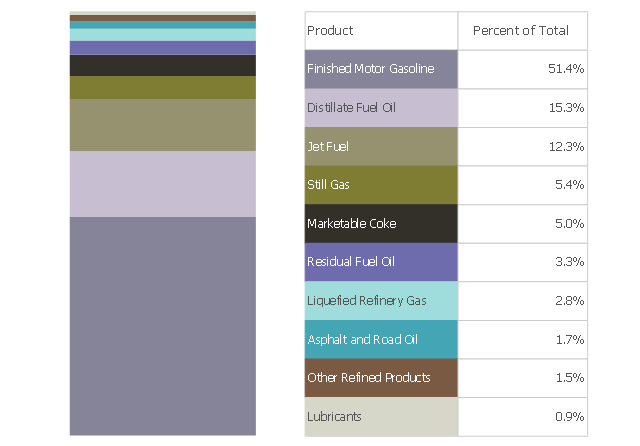
This divided bar chart example was drawn on the base of the picture "Petroleum Products Yielded from One Barrel of Crude Oil in California" from the California Energy Almanac website. [energyalmanac.ca.gov/ gasoline/ whats_ in_ barrel_ oil.html]
"Petroleum products are useful materials derived from crude oil (petroleum) as it is processed in oil refineries. Unlike petrochemicals, which are a collection of well-defined usually pure chemical compounds, petroleum products are complex mixtures. The majority of petroleum is converted to petroleum products, which includes several classes of fuels.
According to the composition of the crude oil and depending on the demands of the market, refineries can produce different shares of petroleum products. The largest share of oil products is used as "energy carriers", i.e. various grades of fuel oil and gasoline. These fuels include or can be blended to give gasoline, jet fuel, diesel fuel, heating oil, and heavier fuel oils. Heavier (less volatile) fractions can also be used to produce asphalt, tar, paraffin wax, lubricating and other heavy oils. Refineries also produce other chemicals, some of which are used in chemical processes to produce plastics and other useful materials. Since petroleum often contains a few percent sulfur-containing molecules, elemental sulfur is also often produced as a petroleum product. Carbon, in the form of petroleum coke, and hydrogen may also be produced as petroleum products. The hydrogen produced is often used as an intermediate product for other oil refinery processes such as hydrocracking and hydrodesulfurization." [Petroleum product. Wikipedia]
The divided bar diagram example "Petroleum products yielded from one barrel of crude oil" was created using the ConceptDraw PRO diagramming and vector drawing software extended with the Divided Bar Diagrams solution from the Graphs and Charts area of ConceptDraw Solution Park.
Divided bar chart
- Bar Graphs | Sales Growth. Bar Graphs Example | Bar Graph | A ...
- Sales Growth. Bar Graphs Example | Bar Chart Examples | Bar ...
- Sales Growth. Bar Graphs Example | Sales Dashboard | Sales ...
- Bar Chart Examples | Bar Diagrams for Problem Solving. Create ...
- Examples of Flowcharts, Org Charts and More | Business Report Pie ...
- Sales Growth. Bar Graphs Example | Bar Graphs | Divided Bar ...
- How to Draw a Divided Bar Chart in ConceptDraw PRO | Divided ...
- Bar Graphs | Line Graphs | Picture Graphs | Graphs
- Bar graph - Serious Crime in Cincinnati | Column Chart Examples ...
- Bar Diagrams for Problem Solving. Create manufacturing and ...
- Bar Chart Examples | Divided bar diagram template | Bar Chart ...
- Bar Graphs | Sales Growth. Bar Graphs Example | Bar Graph | Bar ...
- Sales Growth. Bar Graphs Example | Bar Diagrams for Problem ...
- Sales Growth. Bar Graphs Example | What Is a Picture Graph ...
- Bar Graph Examples
- Bar Graphs | Sales Growth. Bar Graphs Example | Bar Diagrams for ...
- Sales Growth. Bar Graphs Example | Rainfall Bar Chart | Financial ...
- Venn Diagram Examples for Problem Solving. Computer Science ...
- Bar Chart Examples | Bar Graphs | Bar Diagrams for Problem ...
- Pyramid Bar Graph Download Free