Workflow Diagram Examples

 Healthcare Management Workflow Diagrams
Healthcare Management Workflow Diagrams solution contains large set of colorful samples and libraries with predesigned vector pictograms and symbols of health, healthcare equipment, medical instruments, pharmaceutical tools, transport, medication, departments of healthcare organizations, the medical icons of people and human anatomy, flowchart objects, connectors, and arrows, which make it the best for designing clear and comprehensive Medical Workflow Diagrams and Block Diagrams, Healthcare Management Flowcharts and Infographics, Healthcare Workflow Diagram, for depicting the healthcare workflow and clinical workflows in healthcare, for making the workflow analysis healthcare and healthcare workflow management.
Basic of Flowchart: Meaning and Symbols


Software Diagrams

 Workflow Diagrams
Evaluate all advantages of workflow diagram software ConceptDraw DIAGRAM extended with the Workflow Diagrams solution that includes workflow examples and samples, workflow diagram template, a library of workflow diagram symbols and pictorial vector clipart for drawing visual and intuitively understandable Workflow diagrams. Design pictorial Work flow chart or Work flow diagram easier than ever, use them for documentation and implementation purposes, export in a variety of common graphics formats and share with colleagues. Extend the already wide area Work flow diagrams' applications that are used today in the manufacturing industry, software development, HR, medicine, banking and finance sphere, education, military, government, business, e-commerce, and many other fields.
Business Process Workflow Diagrams & Software


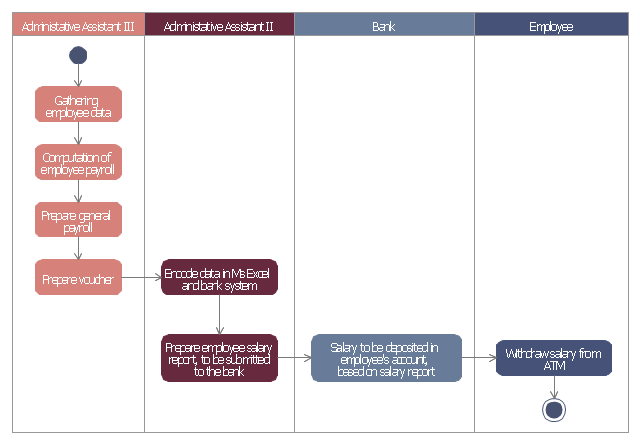
This example of automated payroll management system UML activity diagram was created on the base of figure on the webpage "Automated payroll management system" from ethelmandane.wikispaces.com.
"In the Philippines and in other foreign countries the government has a trend to embrace automation for process efficiency. One of the processes that are being automated is the payroll process. Payroll is the total amount required to pay workers and employees during a week, month or other period.
One of the government offices that desires to automate their payroll system is the NSO Camarines Sur which is located 2nd Floor MMCN Building, Panganiban Avenue, Naga City. The National Statistics Office (NSO) envisions to be recognized as a world-class provider of statistical and civil registration products and services and lives with its mission to produces and provides quality statistical and civil registration products and services. ...
The project seeks to create an Information System Plan for an Automated Payroll Management System. ...
The creation of the Information System Plan will benefit the accounting section of the organization. Specifically it is significant to:
1. Administrative Assistants. It will help to lessen time and effort in preparing and computing the salary of the employee.
2. NSO. It will help the organization to be more productive and efficient."
[ethelmandane.wikispaces.com/ ]
This file is licensed under a Creative Commons Attribution Share-Alike 3.0 License. [creativecommons.org/ licenses/ by-sa/ 3.0/ ]
This UML activity diagram example modeling the automated payroll management system using automated teller machine (ATM) was created using the ConceptDraw PRO diagramming and vector drawing software extended with the ATM UML Diagrams solution from the Software Development area of ConceptDraw Solution Park.
UML activity diagram of automated payroll management system using ATM
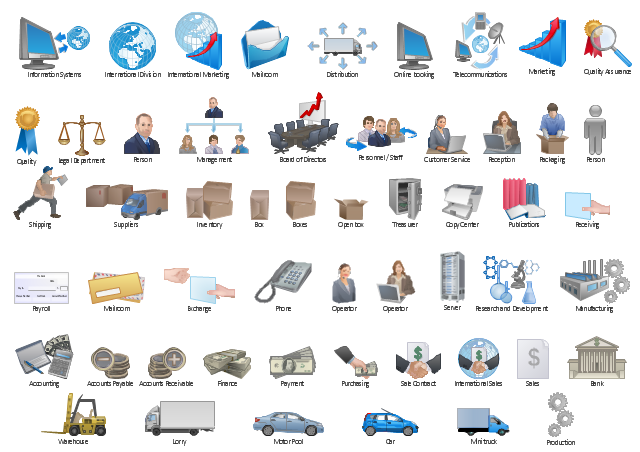
The vector stencils library "Workflow diagrams" contains 54 symbol icons of workflow diagrams.
The workflow diagrams represent information flow, automation of business processes, business process re-engineering, accounting, management, and human resources tasks in industry, business, and manufacturing.
Use this library to draw workflow diagrams in the ConceptDraw PRO diagramming and vector drawing software extended with the Workflow Diagrams solution from the Business Processes area of ConceptDraw Solution Park.
www.conceptdraw.com/ solution-park/ business-process-workflow-diagrams
Accounting

Accounts Payable

Accounts Receivable

Bank

Board of Directors

Copy Center

Customer Service

Distribution

Finance

Information Systems

International Division

International Marketing

International Sales

Inventory

Legal Department

Mailroom 2

Mailroom 1

Management

Manufacturing

Marketing

Motor Pool

Packaging

Payroll

Person 1

Person 2

Personnel/ Staff

Publications

Purchasing

Quality Assurance

Exchange

Reception

Research and Development

Sale contract

Shipping

Suppliers

Telecommunications

Treasurer

Warehouse

Lorry

Quality

Production

Box

Boxes

Open box

Payment

Receiving

Sales

Phone

Operator 1

Online booking

Operator 2

Server

Car

Mini truck

Drawing Workflow Diagrams

 Business Process Workflow Diagrams
The Business Process Workflow Diagrams solution was developed for a purpose of extending the ConceptDraw DIAGRAM software with the pre-made examples and templates of the workflow diagrams, and a library full of vector stencils, workflow chart elements, icons, arrows, connectors for making the needed drawings at an ease. Representing the documents, transferring data and tasks during the performance of the work process has become much simpler for many specialists. The list includes university professors, PhDs, postgraduates, postdocs, scientists, researchers, IT specialists, computer engineers, network and telecommunication engineers, software engineers, technical writers, system administrators, technical support specialists, IT managers, system architects and many other professions.
The Best Business Process Modeling Software: Comprehensive Guide


Kanban Board Software: A Comprehensive Overview

 Scrum Workflow
The Scrum Workflow Solution extends the capabilities of ConceptDraw DIAGRAM with a large collection of professionally-designed samples and a selection of ready-to-use scrum design elements: scrum diagrams and arrows, scrum icons of people, artifacts, workflow, workspace and other colorful scrum clipart, and also scrum charts.
"Microsoft SharePoint is a Web application platform developed by Microsoft. First launched in 2001, SharePoint has historically been associated with intranet, content management and document management, but recent versions have significantly broader capabilities.
SharePoint comprises a multipurpose set of Web technologies backed by a common technical infrastructure. By default, SharePoint has a Microsoft Office-like interface, and it is closely integrated with the Office suite. The web tools are designed to be usable by non-technical users. SharePoint can be used to provide intranet portals, document & file management, collaboration, social networks, extranets, websites, enterprise search, and business intelligence. It also has system integration, process integration, and workflow automation capabilities.
Enterprise application software (e.g. ERP or CRM packages) often provide some SharePoint integration capability, and SharePoint also incorporates a complete development stack based on web technologies and standards-based APIs. As an application platform, SharePoint provides central management, governance, and security controls for implementation of these requirements. The SharePoint platform integrates directly into IIS - enabling bulk management, scaling, and provisioning of servers, as is often required by large organizations or cloud hosting providers." [Microsoft SharePoint. Wikipedia]
The AWS architecture diagram example "SharePoint server reference architecture for public-facing website scenario" was created using the ConceptDraw PRO diagramming and vector drawing software extended with the AWS Architecture Diagrams solution from the Computer and Networks area of ConceptDraw Solution Park.
AWS architecture diagram

The vector stencils library "Workflow diagrams" contains 54 symbol icons for drawing the work flow charts.
Use these clipart to represent information flow, automation of business processes, business process re-engineering, accounting, management, and human resources tasks in industry, business, and manufacturing.
"A workflow consists of an orchestrated and repeatable pattern of business activity enabled by the systematic organization of resources into processes that transform materials, provide services, or process information. It can be depicted as a sequence of operations, declared as work of a person or group, an organization of staff, or one or more simple or complex mechanisms.
From a more abstract or higher-level perspective, workflow may be a view or representation of real work, thus serving as a virtual representation of actual work. The flow being described may refer to a document, service or product that is being transferred from one step to another.
Workflows may be viewed as one fundamental building block to be combined with other parts of an organisation's structure such as information silos, teams, projects, policies and hierarchies." [Workflow. Wikipedia]
The clipart example "Design elements - Workflow diagram" was drawn using the ConceptDraw PRO diagramming and vector drawing software extended with the Workflow Diagrams solution from the Business Processes area of ConceptDraw Solution Park.
Workflow symbols
How to Design a Good Workflow

Software development with ConceptDraw DIAGRAM

The vector stencils library "Workflow diagrams" contains 54 symbol icons of workflow diagrams.
Use these clipart to represent information flow, automation of business processes, business process re-engineering, accounting, management, and human resources tasks in industry, business, and manufacturing.
"The term workflow is more commonly used in particular industries, such as printing and professional domains, where it may have particular specialized meanings.
(1) Processes: A process is a more general notion than workflow and can apply to physical or biological processes, for instance; whereas a workflow is typically a process or collection of processes described in the context of work, such as all processes occurring in a machine shop.
(2) Planning and scheduling: A plan is a description of the logically necessary, partially ordered set of activities required to accomplish a specific goal given certain starting conditions. A plan, when augmented with a schedule and resource allocation calculations, completely defines a particular instance of systematic processing in pursuit of a goal. A workflow may be viewed as an (often optimal or near-optimal) realization of the mechanisms required to execute the same plan repeatedly.
(3) Flow control is a control concept applied to workflows, to distinguish from static control of buffers of material or orders, to mean a more dynamic control of flow speed and flow volumes in motion and in process. Such orientation to dynamic aspects is the basic foundation to prepare for more advanced job shop controls, such as just-in-time or just-in-sequence.
(4) In-transit visibility is a monitoring concept that applies to transported material as well as to work in process or work in progress, i.e., workflows." [Workflow. Wikipedia]
The example "Workflow diagram - Business" was drawn using the ConceptDraw PRO diagramming and vector drawing software extended with the Workflow Diagrams solution from the Business Processes area of ConceptDraw Solution Park.
Business - Work flow chart

Workflow Diagram Software

Nature Drawings - How to Draw

- Software workflow diagram | Automated payroll management system ...
- Business Process Workflow Diagrams | Visio Exchange | Email ...
- Automated payroll management system UML activity diagram ...
- Basic Flowchart Symbols and Meaning | Workflow Automation System
- Hiring process workflow | Automated payroll management system ...
- Basic Flowchart Symbols and Meaning | ER Diagram Tool
- Automated payroll management system UML activity diagram ...
- Basic Flowchart Symbols and Meaning | Process Flowchart
- Automated payroll management system UML activity diagram | UML ...
- Workflow diagrams - Vector stencils library | ER Diagram Tool ...