This example of automated payroll management system UML activity diagram was created on the base of figure on the webpage "Automated payroll management system" from ethelmandane.wikispaces.com.
"In the Philippines and in other foreign countries the government has a trend to embrace automation for process efficiency. One of the processes that are being automated is the payroll process. Payroll is the total amount required to pay workers and employees during a week, month or other period.
One of the government offices that desires to automate their payroll system is the NSO Camarines Sur which is located 2nd Floor MMCN Building, Panganiban Avenue, Naga City. The National Statistics Office (NSO) envisions to be recognized as a world-class provider of statistical and civil registration products and services and lives with its mission to produces and provides quality statistical and civil registration products and services. ...
The project seeks to create an Information System Plan for an Automated Payroll Management System. ...
The creation of the Information System Plan will benefit the accounting section of the organization. Specifically it is significant to:
1. Administrative Assistants. It will help to lessen time and effort in preparing and computing the salary of the employee.
2. NSO. It will help the organization to be more productive and efficient."
[ethelmandane.wikispaces.com/ ]
This file is licensed under a Creative Commons Attribution Share-Alike 3.0 License. [creativecommons.org/ licenses/ by-sa/ 3.0/ ]
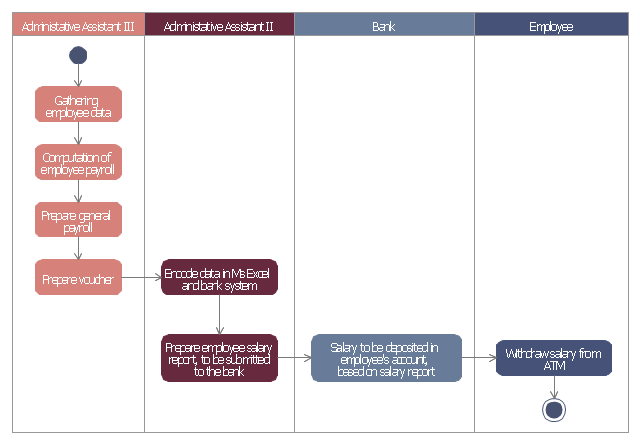
This UML activity diagram example modeling the automated payroll management system using automated teller machine (ATM) was created using the ConceptDraw PRO diagramming and vector drawing software extended with the ATM UML Diagrams solution from the Software Development area of ConceptDraw Solution Park.
"In the Philippines and in other foreign countries the government has a trend to embrace automation for process efficiency. One of the processes that are being automated is the payroll process. Payroll is the total amount required to pay workers and employees during a week, month or other period.
One of the government offices that desires to automate their payroll system is the NSO Camarines Sur which is located 2nd Floor MMCN Building, Panganiban Avenue, Naga City. The National Statistics Office (NSO) envisions to be recognized as a world-class provider of statistical and civil registration products and services and lives with its mission to produces and provides quality statistical and civil registration products and services. ...
The project seeks to create an Information System Plan for an Automated Payroll Management System. ...
The creation of the Information System Plan will benefit the accounting section of the organization. Specifically it is significant to:
1. Administrative Assistants. It will help to lessen time and effort in preparing and computing the salary of the employee.
2. NSO. It will help the organization to be more productive and efficient."
[ethelmandane.wikispaces.com/ ]
This file is licensed under a Creative Commons Attribution Share-Alike 3.0 License. [creativecommons.org/ licenses/ by-sa/ 3.0/ ]
This UML activity diagram example modeling the automated payroll management system using automated teller machine (ATM) was created using the ConceptDraw PRO diagramming and vector drawing software extended with the ATM UML Diagrams solution from the Software Development area of ConceptDraw Solution Park.
UML activity diagram of automated payroll management system using ATM
Workflow Diagram Examples

Basic Flowchart Symbols and Meaning


UML Activity Diagram

UML Use Case Diagram Example - Estate Agency

Interaction Overview Diagram


Create UML Diagram

Cause and Effect Diagrams


A four level pyramid model of different types of Information Systems based on the different levels of hierarchy in an organization. The first level represents transaction processing systems for workers. The second level represents management information systems for middle managers. The third level represents decision support systems for senior menegers. The fourth level represents executive information systems for executives.
"The "classic" view of Information systems found in the textbooks in the 1980s was of a pyramid of systems that reflected the hierarchy of the organization, usually transaction processing systems at the bottom of the pyramid, followed by management information systems, decision support systems, and ending with executive information systems at the top. Although the pyramid model remains useful, since it was first formulated a number of new technologies have been developed and new categories of information systems have emerged, some of which no longer fit easily into the original pyramid model.
Some examples of such systems are:
data warehouses,
enterprise resource planning,
enterprise systems,
expert systems,
search engines,
geographic information system,
global information system,
office automation." [Information systems. Wikipedia]
This diagram was redesigned using the ConceptDraw PRO diagramming and vector drawing software from Wikimedia Commons file Four-Level-Pyramid-model.png. [commons.wikimedia.org/ wiki/ File:Four-Level-Pyramid-model.png]
This file is licensed under the Creative Commons Attribution-Share Alike 3.0 Unported license. [creativecommons.org/ licenses/ by-sa/ 3.0/ deed.en]
The triangle chart example "Information systems types" is included in the Pyramid Diagrams solution from the Marketing area of ConceptDraw Solution Park.
Pyramid diagram

Drawing Workflow Diagrams

Bank System

UML Diagram of Parking

UML Component Diagram Example - Online Shopping

Jacobson Use Cases Diagram

- Diagram Of Office Automation System
- Automated payroll management system UML activity diagram | UML ...
- Basic Flowchart Symbols and Meaning | Workflow Diagram ...
- Automated payroll management system UML activity diagram ...
- Bank System | UML for Bank | Bank Sequence Diagram | Bank ...
- Canteen Automation System Er Diagram
- Automated Po System Flow Diagram
- UML Activity Diagram | UML Diagram of Parking | UML Use Case ...
- Diagram Of Process Control Instrument In Automation
- Office Automation Equipment Diagram
- Parking Lot Automation System Activity Diagram
- Restaurant Automation Data Flow Diagram
- Automated payroll management system UML activity diagram | Swim ...
- Basic Flowchart Symbols and Meaning | Workflow Diagram ...
- Entity-Relationship Diagram (ERD) | Data Flow Diagrams (DFD ...
- Home area network wiring diagram | Software development with ...
- Basic Flowchart Symbols and Meaning | Workflow Diagram ...
- UML Activity Diagram | PM Personal Time Management | Automated ...
- Workflow Diagram Symbols | Physics Symbols | Instrument Control ...
- DFD Library System | Data Flow Diagram Symbols. DFD Library ...