Affinity Diagram

Affinity Diagram

Affinity Diagram Software

How To Create Onion Diagram

The Action Plan


PDPC

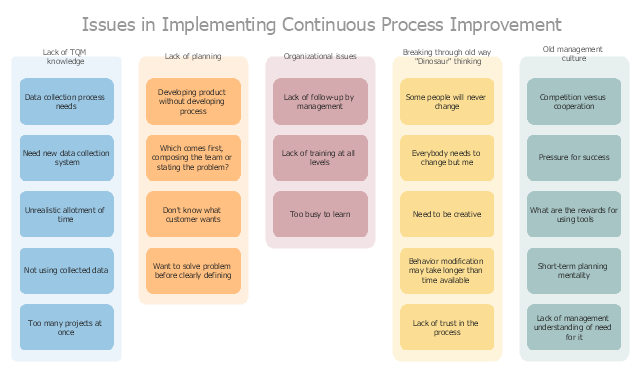
"A continual improvement process, also often called a continuous improvement process (abbreviated as CIP or CI), is an ongoing effort to improve products, services, or processes. These efforts can seek "incremental" improvement over time or "breakthrough" improvement all at once. Delivery (customer valued) processes are constantly evaluated and improved in the light of their efficiency, effectiveness and flexibility.
Some see CIPs as a meta-process for most management systems (such as business process management, quality management, project management, and program management)." [Continual improvement process. Wikipedia]
The affinity diagram example "Implementing continuous process improvement" was created using the ConceptDraw PRO diagramming and vector drawing software extended with the solution "Seven Management and Planning Tools" from the Management area of ConceptDraw Solution Park.
Affinity diagram
Cause and Effect Fishbone Diagram

Venn Diagram Examples for Problem Solving. Venn Diagram as a Truth Table

Scientific Symbols Chart

Mathematics Solution from the Science and Education area of ConceptDraw Solution Park includes a few shape libraries of plane, solid geometric figures, trigonometrical functions and greek letters to help you create different professional looking mathematic illustrations for science and education.
Organizational Charts with ConceptDraw DIAGRAM

HelpDesk
How To Create an Affinity Diagram Using Solutions

Total Quality Management

 Seven Management and Planning Tools
Seven Management and Planning Tools solution extends ConceptDraw DIAGRAM and ConceptDraw MINDMAP with features, templates, samples and libraries of vector stencils for drawing management mind maps and diagrams.
Pyramid Diagram and Pyramid Chart

- Affinity Diagrams Examples
- Affinity Diagram | Process Flowchart | Seven Management and ...
- Affinity Diagram | Affinity diagram - Implementing continuous ...
- Affinity Diagram | Affinity Diagram Software | PDPC | Pdf Affinity ...
- Affinity Diagram Software | Total Quality Management | Affinity ...
- Example Of Affinity Diagram For Management
- Flow chart Example . Warehouse Flowchart | Affinity Diagram | Cross ...
- Affinity diagram - Business expansion | BPR Diagram. Business ...
- Affinity Diagram | Venn Diagram Examples for Problem Solving ...
- Affinity Diagram | Affinity Diagram | Flowchart Marketing Process ...
- Simple Example For Affinity Diagram
- Examples of Flowcharts, Org Charts and More | Quality | Affinity ...
- PDPC | Affinity Diagram | Seven Management and Planning Tools ...
- Affinity Diagram Examples Ppt
- Affinity Diagram Example Tqm
- Process Diagrams | Affinity Diagram | Bar Diagram Math | Easy ...
- Example Of Affinity Diagram Business Requirements
- Example Of Affinity Diagram
- Affinity Diagram | How To Create an Affinity Diagram Using ...
- Affinity Diagram Examples Image