The Action Plan


Activity Network Diagram Method

PROBLEM ANALYSIS. Root Cause Analysis Tree Diagram

"An automated teller machine or automatic teller machine" (ATM) (American, Australian, Singaporean, Indian, and Hiberno-English), also known as an automated banking machine (ABM) (Canadian English), cash machine, cashpoint, cashline or hole in the wall (British, South African, and Sri Lankan English), is an electronic telecommunications device that enables the clients of a financial institution to perform financial transactions without the need for a cashier, human clerk or bank teller.
On most modern ATMs, the customer is identified by inserting a plastic ATM card with a magnetic stripe or a plastic smart card with a chip that contains a unique card number and some security information such as an expiration date or CVVC (CVV). Authentication is provided by the customer entering a personal identification number (PIN). The newest ATM at Royal Bank of Scotland allows customers to withdraw cash up to £100 without a card by inputting a six-digit code requested through their smartphones.
Using an ATM, customers can access their bank accounts in order to make cash withdrawals, get debit card cash advances, and check their account balances as well as purchase pre-paid mobile phone credit. If the currency being withdrawn from the ATM is different from that which the bank account is denominated in (e.g.: Withdrawing Japanese yen from a bank account containing US dollars), the money will be converted at an official wholesale exchange rate. Thus, ATMs often provide one of the best possible official exchange rates for foreign travellers, and are also widely used for this purpose." [Automated teller machine. Wikipedia]
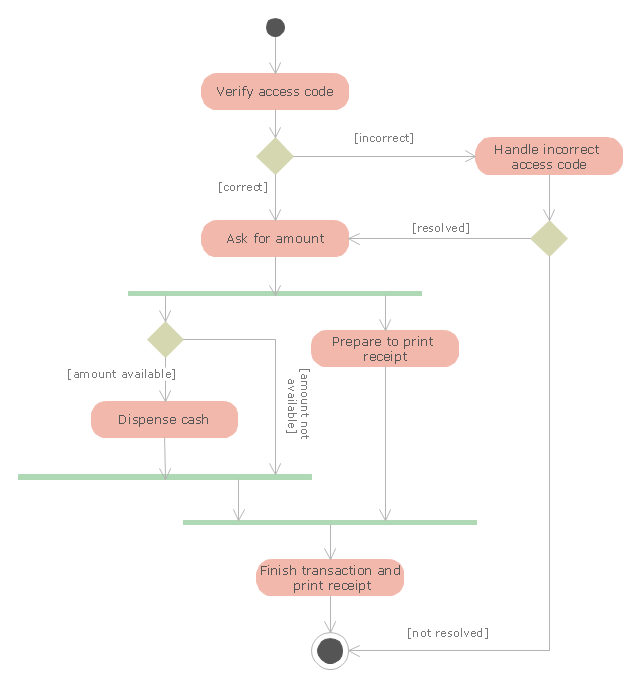
The UML activity diagram example "Cash withdrawal from ATM" was created using the ConceptDraw PRO diagramming and vector drawing software extended with the Rapid UML solution from the Software Development area of ConceptDraw Solution Park.
On most modern ATMs, the customer is identified by inserting a plastic ATM card with a magnetic stripe or a plastic smart card with a chip that contains a unique card number and some security information such as an expiration date or CVVC (CVV). Authentication is provided by the customer entering a personal identification number (PIN). The newest ATM at Royal Bank of Scotland allows customers to withdraw cash up to £100 without a card by inputting a six-digit code requested through their smartphones.
Using an ATM, customers can access their bank accounts in order to make cash withdrawals, get debit card cash advances, and check their account balances as well as purchase pre-paid mobile phone credit. If the currency being withdrawn from the ATM is different from that which the bank account is denominated in (e.g.: Withdrawing Japanese yen from a bank account containing US dollars), the money will be converted at an official wholesale exchange rate. Thus, ATMs often provide one of the best possible official exchange rates for foreign travellers, and are also widely used for this purpose." [Automated teller machine. Wikipedia]
The UML activity diagram example "Cash withdrawal from ATM" was created using the ConceptDraw PRO diagramming and vector drawing software extended with the Rapid UML solution from the Software Development area of ConceptDraw Solution Park.
UML activity diagram
Activity on Node Network Diagramming Tool

Corrective Action Planning

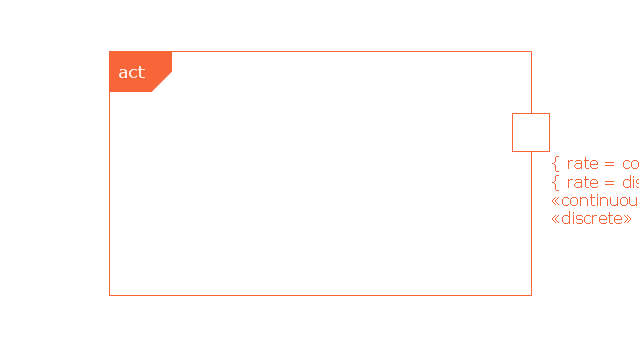
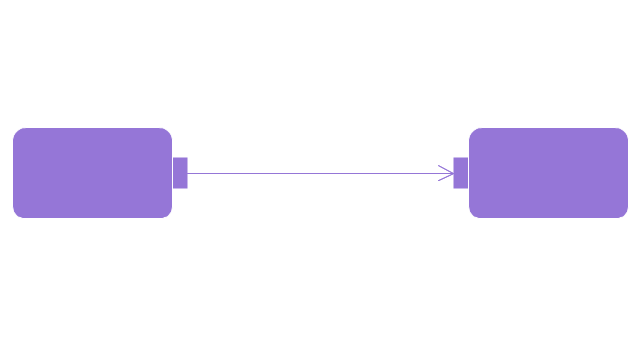
This vector stencils library contains 47 SysML activity diagram symbols.
Use it to design your SysML activity diagrams using ConceptDraw PRO diagramming and vector drawing software.
"Activity diagrams are constructed from a limited number of shapes, connected with arrows. The most important shape types:
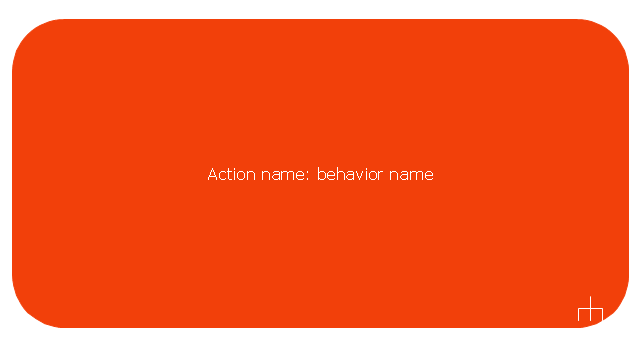
- rounded rectangles represent actions;
- diamonds represent decisions;
- bars represent the start (split) or end (join) of concurrent activities;
- a black circle represents the start (initial state) of the workflow;
- an encircled black circle represents the end (final state).
Arrows run from the start towards the end and represent the order in which activities happen." [Activity diagram. Wikipedia]
The vector stencils library "Activity diagram" is included in the SysML solution from the Software Development area of ConceptDraw Solution Park.
Use it to design your SysML activity diagrams using ConceptDraw PRO diagramming and vector drawing software.
"Activity diagrams are constructed from a limited number of shapes, connected with arrows. The most important shape types:
- rounded rectangles represent actions;
- diamonds represent decisions;
- bars represent the start (split) or end (join) of concurrent activities;
- a black circle represents the start (initial state) of the workflow;
- an encircled black circle represents the end (final state).
Arrows run from the start towards the end and represent the order in which activities happen." [Activity diagram. Wikipedia]
The vector stencils library "Activity diagram" is included in the SysML solution from the Software Development area of ConceptDraw Solution Park.
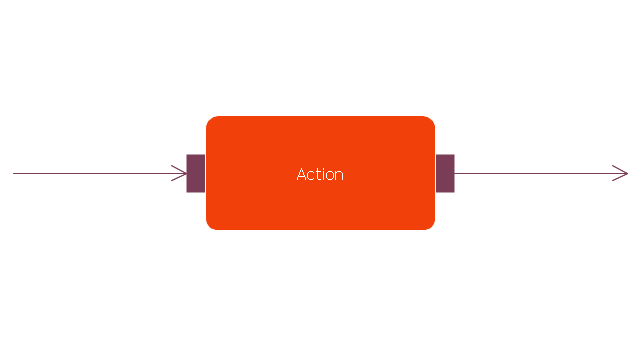
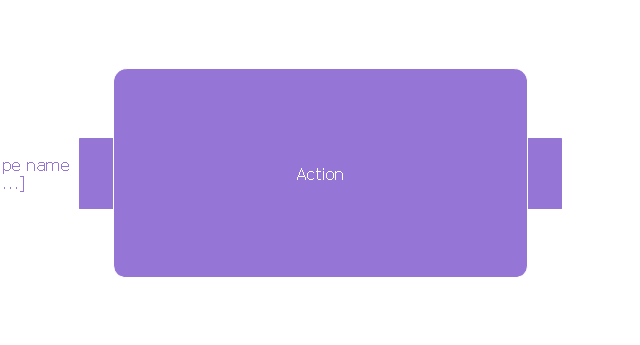
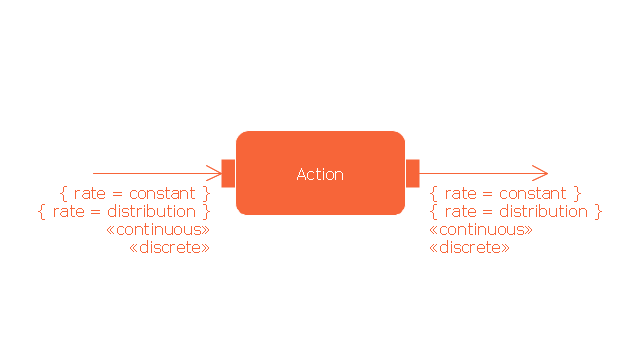
Action

Call behavior action
Accept event action

Accept time event action

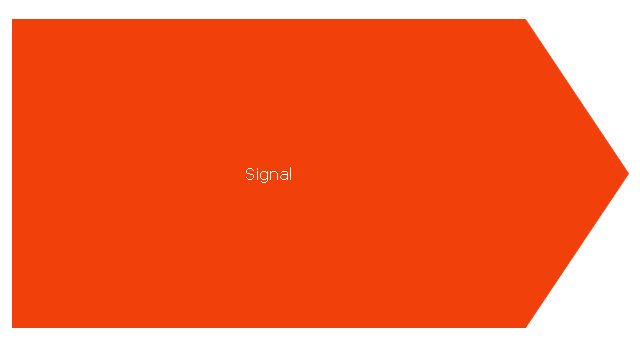
Send signal action
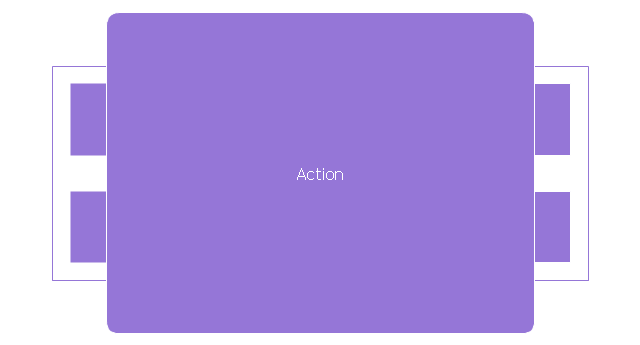
Activity

Activity final node

Flow final node

Activity parameter node

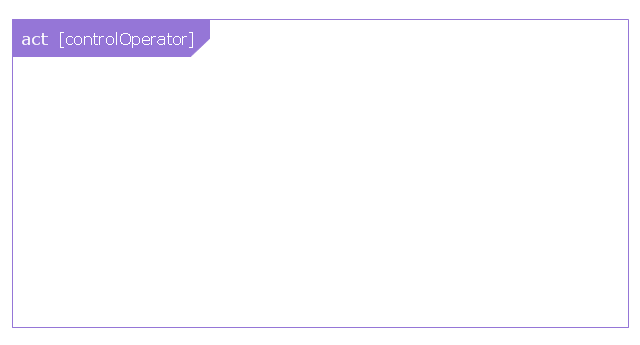
Control operator node
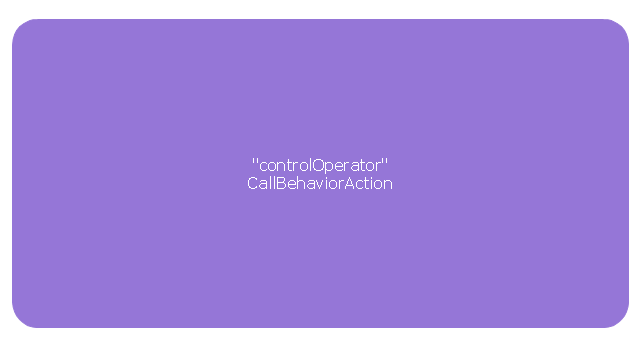
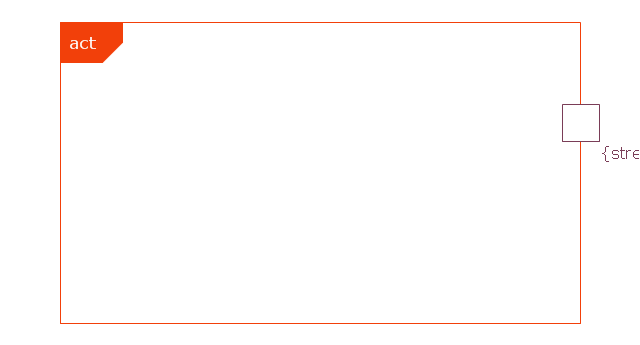
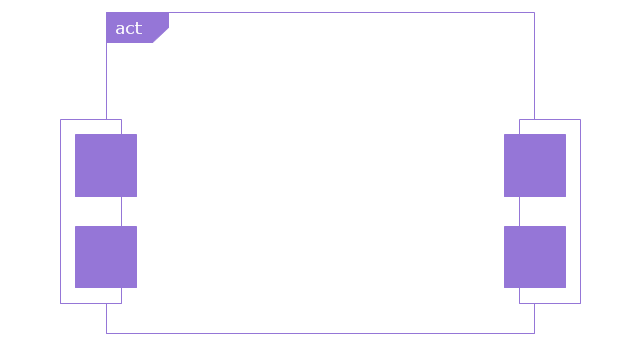
Control operator - frame
Decision/Merge node

Fork/Join node

Initial node

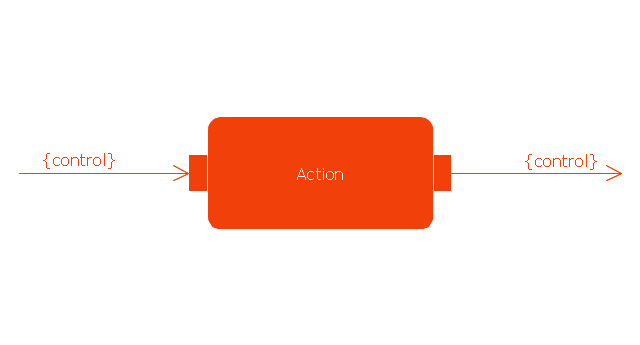
isControl
isStream
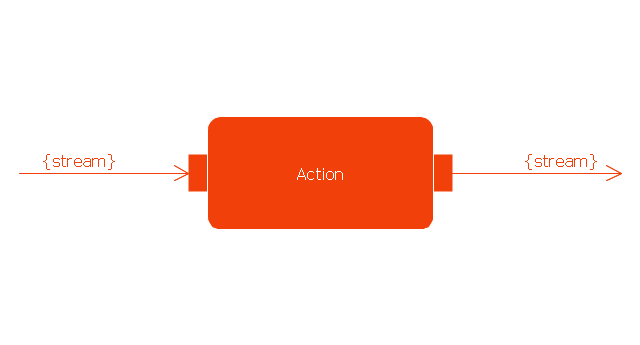
isStream 2
isStream 3
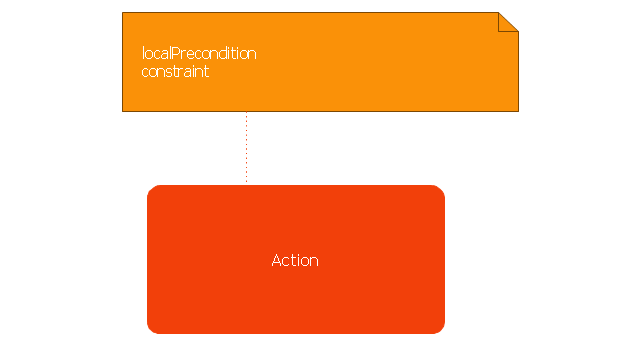
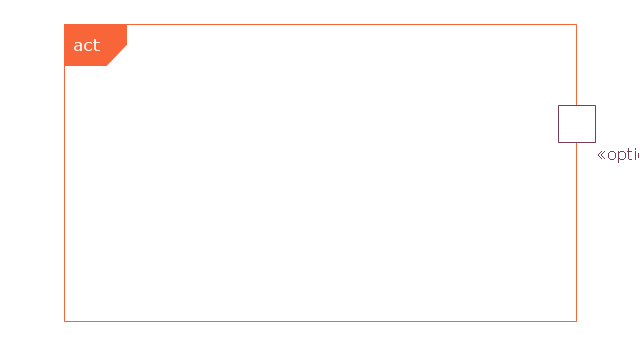
Local precondition
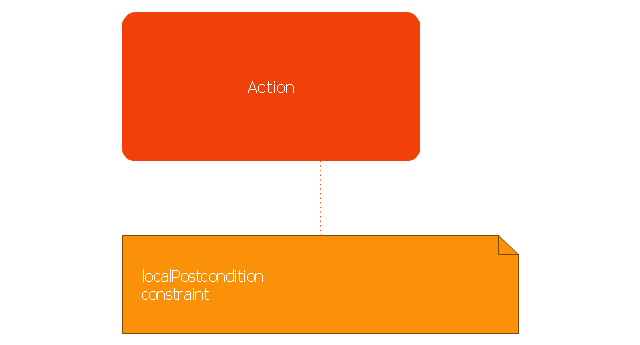
Local postcondition
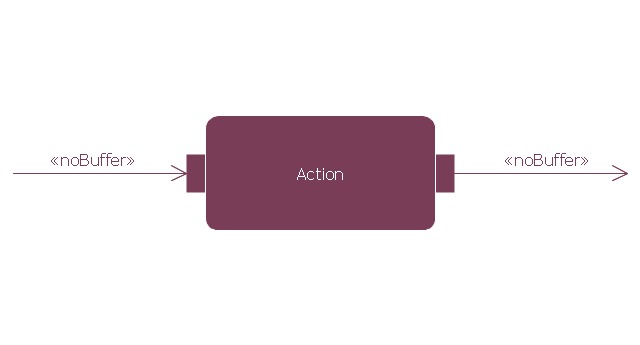
NoBuffer
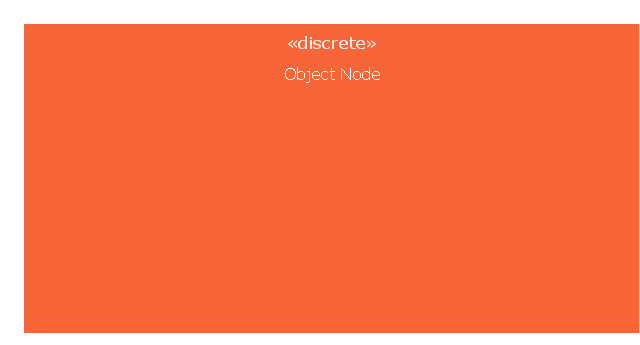
Object node
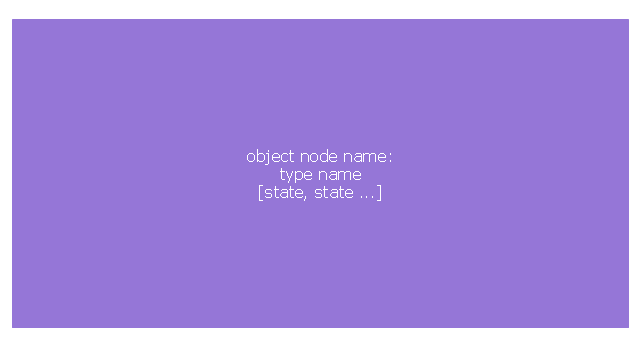
Object node 2
Optional
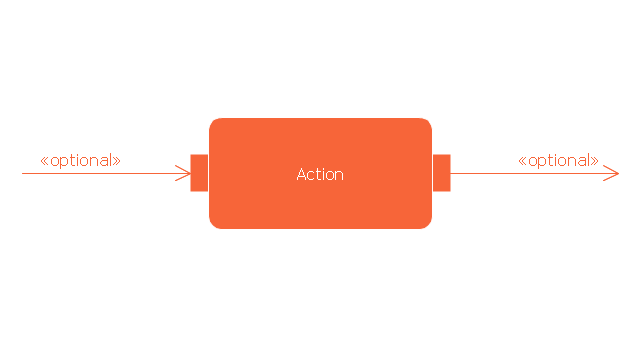
Optional 2
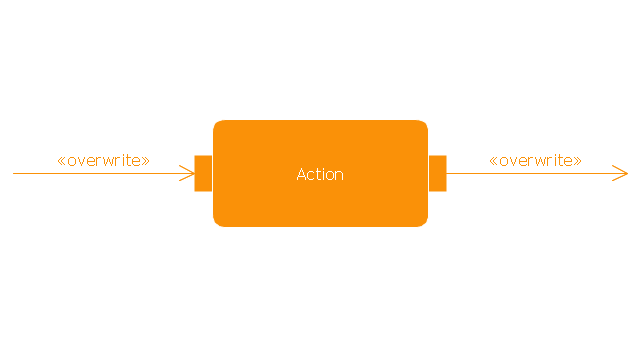
OverWrite
Parameter set
Parameter set 2
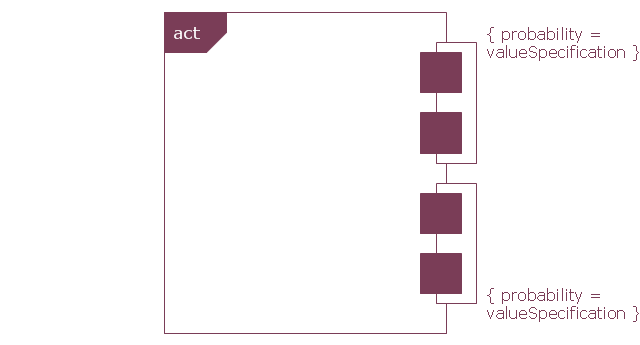
Probability
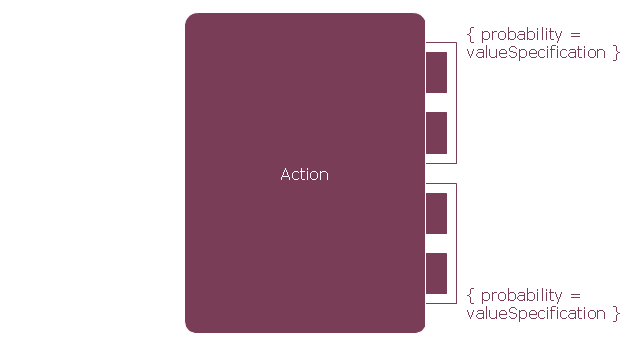
Probability 2
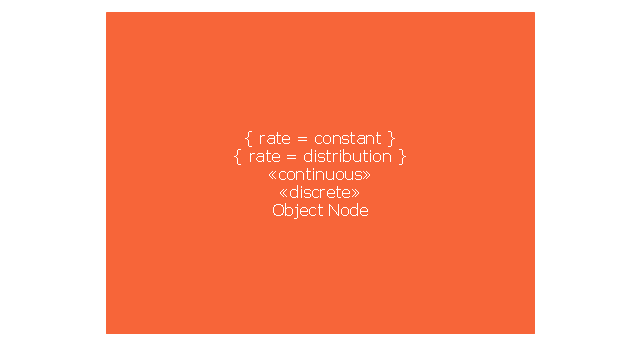
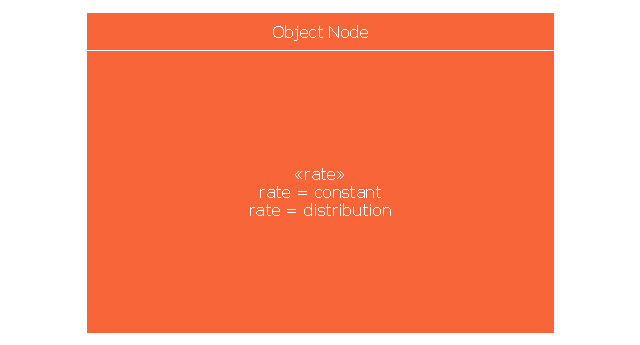
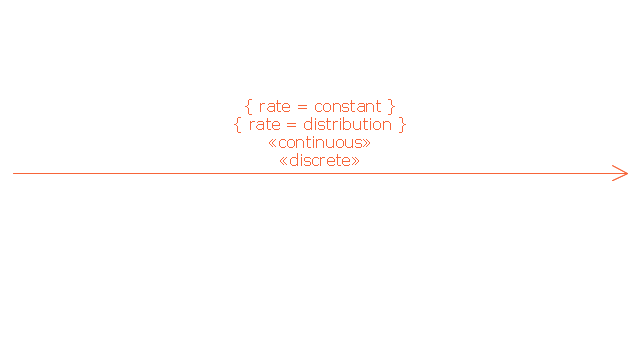
Rate

Rate 2
Rate 3
Rate 4
Rate 5
Rate 6
Control flow
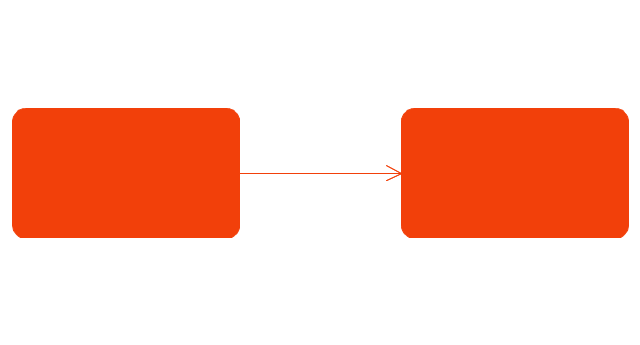
Control flow 2
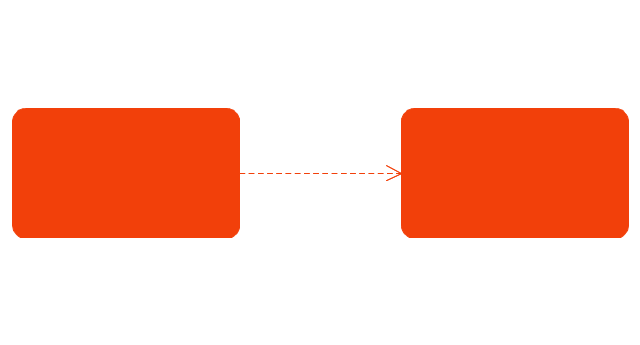
Object flow
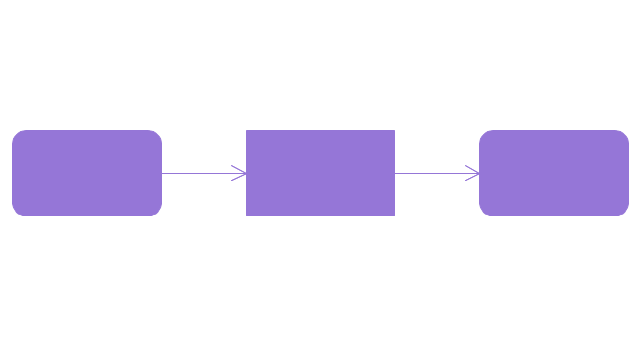
Object flow 2
Probability path

Rate path
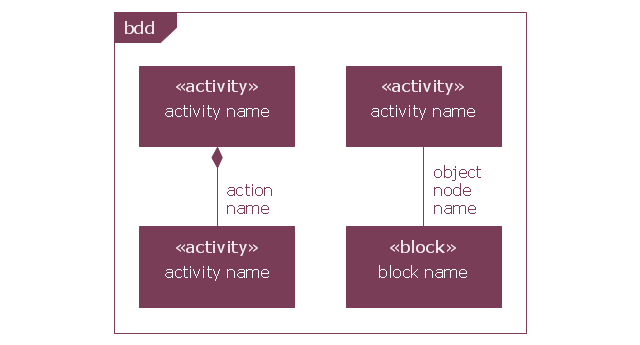
In block definition diagram, activity, association
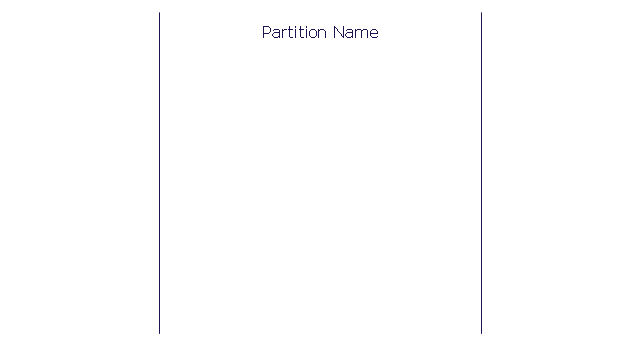
Activity partition
Activity partition - action

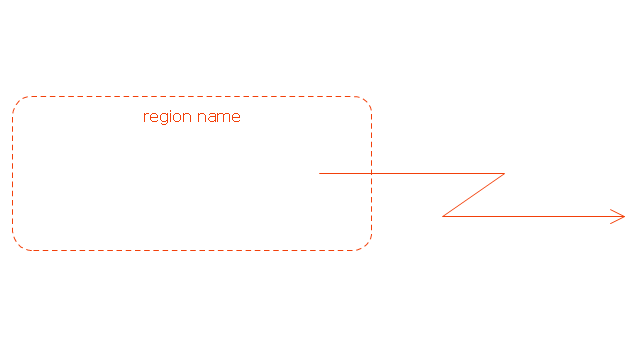
Interruptible activity region
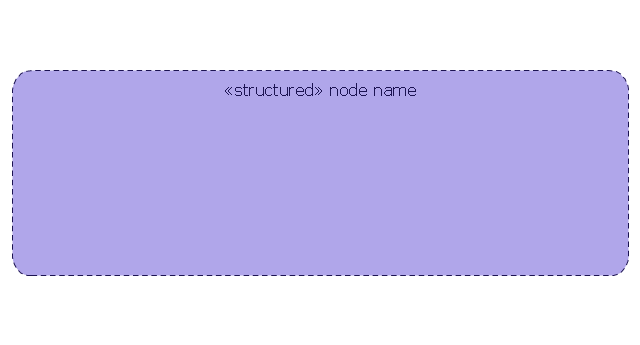
Structured activity node
CORRECTIVE ACTIONS PLANNING. Risk Diagram (PDPC)
 - Health care")
UML Activity Diagram. Design Elements
")

Process Flowchart


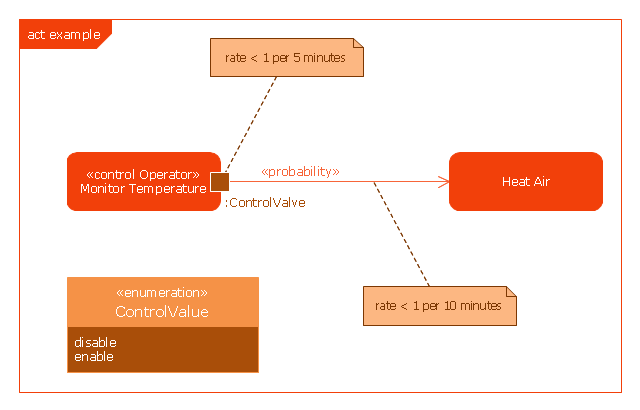
This example was drawn on the base of SysML activity diagram on the page 8 of "SysML Modelling Language explained" document from the Official OMG SysML site.
"The activity diagram represents steps of a process, often making use of “input and output pins” that respectively correspond to the element type required as the input of an activity or action, and the element generated as an output.
If an action or activity corresponds to a block operation, it is possible to ensure that the types of the input and output of this activity are consistent with the block operation signature.
All the activity diagrams definitions used in UML also apply to SysML.
SysML has added a couple of extensions:
- With UML, control can only enable actions to start. SysML extends control to support disabling of actions that are already executing.
- Definition of the flow rate : continuous or discrete
- Definition of the rate and probability on the control or object flows"
[omgsysml.org/ SysML_ Modelling_ Language_ explained-finance.pdf]
The example "SysML activity diagram" was drawn using the ConceptDraw PRO diagramming and vector drawing software extended with the SysML solution from the Software Development area of ConceptDraw Solution Park.
Example of SysML activity diagram
Cause and Effect Analysis

Preventive Action
 - Minimization-of-material-wastage")
Garrett IA Diagrams with ConceptDraw PRO

Activity Network (PERT) Chart

- UML activity diagram - Cash withdrawal from ATM | UML Activity ...
- Root cause analysis tree diagram - Template | PROBLEM ...
- Activity Diagram For User Registration
- CORRECTIVE ACTIONS PLANNING. Risk Diagram (PDPC) | Risk ...
- Corrective Action Diagram
- Process decision program chart (PDPC) - Personal activity | Risk ...
- CORRECTIVE ACTIONS PLANNING. Risk Diagram (PDPC)
- Risk diagram (PDPC) - Template | PDPC | CORRECTIVE ACTIONS ...
- Decision Making | CORRECTIVE ACTIONS PLANNING. Risk ...
- CORRECTIVE ACTIONS PLANNING. Risk Diagram (PDPC) | How ...
- Bank Activity Diagram
- The Action Plan | Seven Management and Planning Tools | Activity ...
- UML Activity Diagram | Diagramming Software for Design UML ...
- Internet symbols - Vector stencils library | UML activity diagram ...
- Preventive Action | CORRECTIVE ACTIONS PLANNING. Risk ...
- Block diagram - Planning process | The Action Plan | How To use ...
- CORRECTIVE ACTIONS PLANNING. Risk Diagram (PDPC) | Social ...
- Activity Diagram Template
- PDPC | Risk diagram (PDPC) - Template | Preventive Action | Pdpc ...