 Infographics Area
Solutions of the area What is Infographics from ConceptDraw Solution Park collect templates, samples and vector stencils libraries with design elements for the drawing information graphics.
Pyramid Diagram and Pyramid Chart

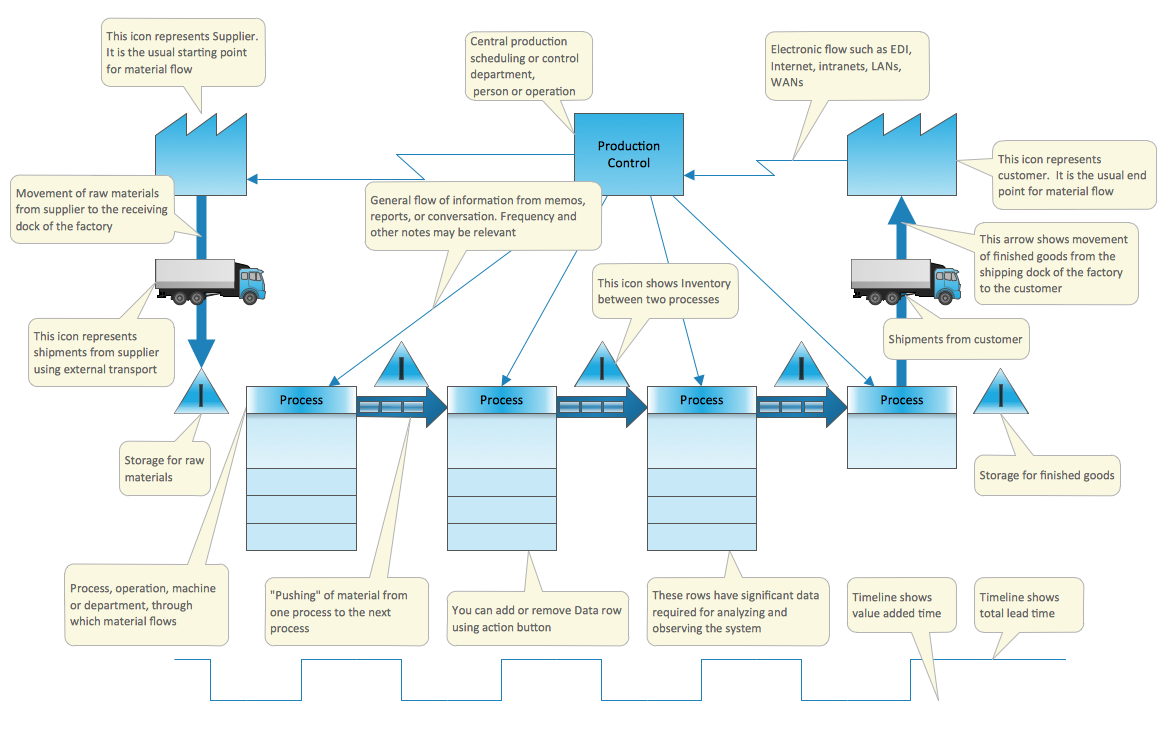
Value Stream Mapping Template
Pyramid Charts

Spatial Data Analysis
 Marketing
This solution extends ConceptDraw DIAGRAM and ConceptDraw MINDMAP with Marketing Diagrams and Mind Maps (brainstorming, preparing and holding meetings and presentations, sales calls).
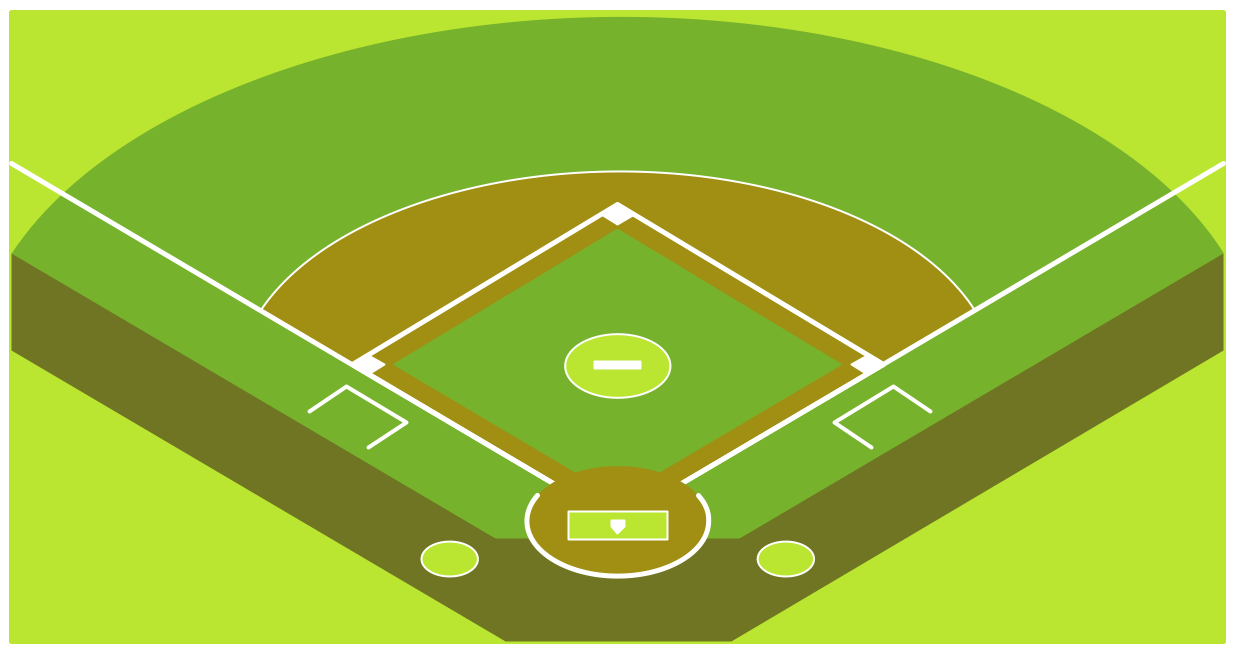
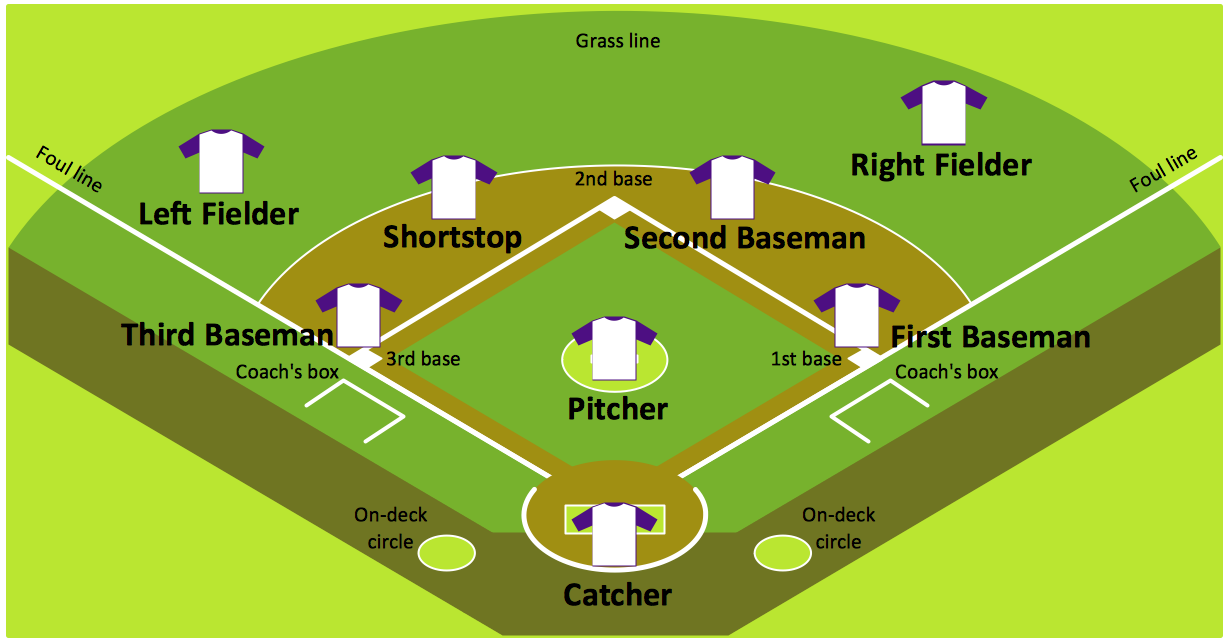
Baseball Diagram – Baseball Field – Corner View – Template
Workflow Flowchart Symbols

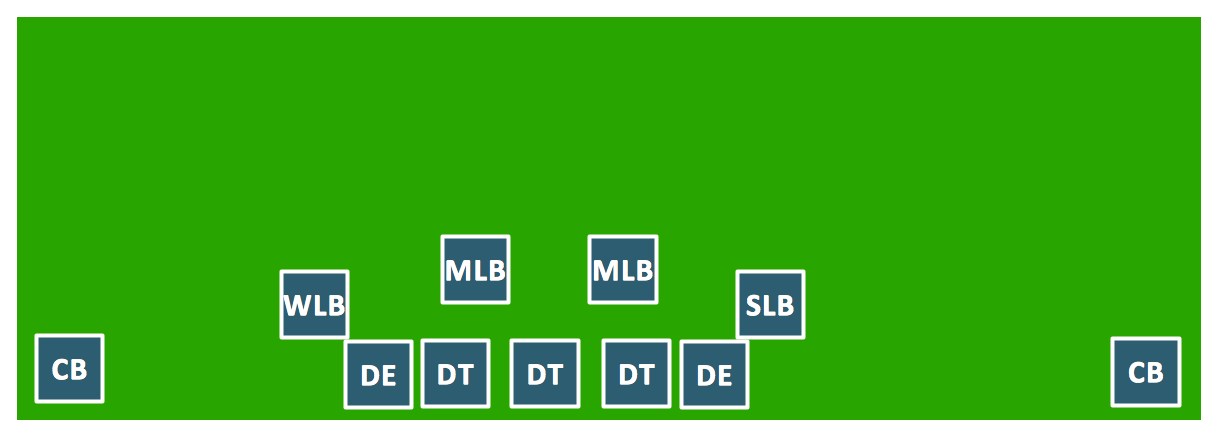
Infield Positioning for Baseball Situations

HelpDesk
ConceptDraw OFFICE for macOS Installation Definition

 Cross-Functional Flowcharts
Cross-functional flowcharts are powerful and useful tool for visualizing and analyzing complex business processes which requires involvement of multiple people, teams or even departments. They let clearly represent a sequence of the process steps, the order of operations, relationships between processes and responsible functional units (such as departments or positions).
Goal Line Formation (Offense/Defense) Diagram
Baseball Diagram — Baseball Field — Corner View — Sample
Ice Hockey Positions Diagram

- 5 Step Marketing Process Diagran
- Five forces model - Template | Marketing Charts | Marketing ...
- Basketball Defense Drills | Cross-Functional Flowcharts | How to ...
- Product life cycle graph - Template
- Top 5 Android Flow Chart Apps | Fruit Art | Army Flow Charts | Flow ...
- Marketing diagrams - Vector stencils library | Target and Circular ...
- Conceptdraw.com: Mind Map Software, Drawing Tools | Project ...
- How to Draw a Circular Arrows Diagram Using ConceptDraw PRO ...
- Pyramid Chart Examples | Pie Chart Word Template . Pie Chart ...
- Five Forces Model Template Word
- Business Process Modeling Notation Template | Workflow Diagram ...
- Marketing diagrams - Vector stencils library | Draw Flowcharts with ...
- Step chart - Template | Process Flowchart | Basic Flowchart Symbols ...
- Pyramid Diagram | Funnel diagram - Template | Purchase funnel ...
- Swot Template Mac Pages
- Basic Flowchart Symbols and Meaning | How to Design a Food ...
- Flowchart Maker | Pyramid Chart Maker | Top 5 Android Flow Chart ...
- Circular diagrams - Vector stencils library | Pie Chart Examples and ...
- Bar Chart Software | Chart Maker for Presentations | Bar Chart ...
- How to Create Data-driven Infographics | How to Add Data-driven ...