Basketball Defense Drills

 Cross-Functional Flowcharts
Cross-functional flowcharts are powerful and useful tool for visualizing and analyzing complex business processes which requires involvement of multiple people, teams or even departments. They let clearly represent a sequence of the process steps, the order of operations, relationships between processes and responsible functional units (such as departments or positions).
HelpDesk
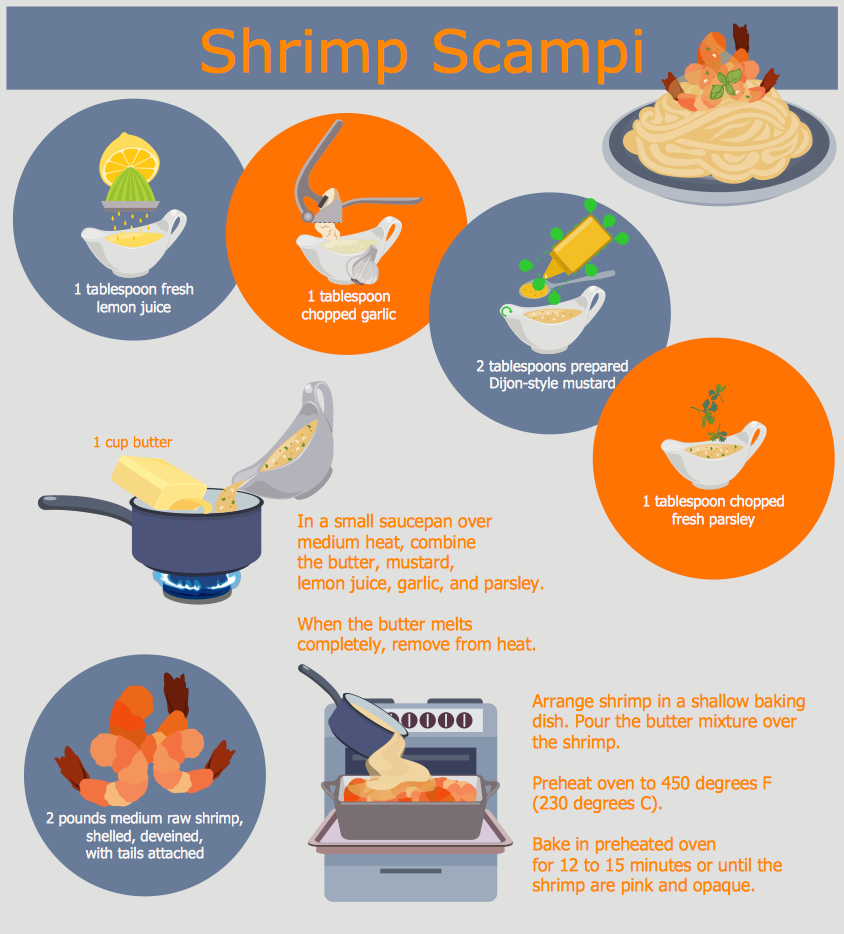
How to Create Infographics that Help People Eat Healthy

HelpDesk
How to Design a Food-related Infographics
 Venn Diagrams
Venn Diagrams are actively used to illustrate simple set relationships in set theory and probability theory, logic and statistics, mathematics and computer science, linguistics, sociology, and marketing. Venn Diagrams are also often used to visually summarize the status and future viability of a project.
 Football
The Football Solution extends ConceptDraw DIAGRAM.5 (or later) software with samples, templates, and libraries of vector objects for drawing football (American) diagrams, plays schemas, and illustrations. It can be used to make professional looking documen
 Interactive Voice Response Diagrams
Interactive Voice Response Diagrams solution extends ConceptDraw DIAGRAM software with samples, templates and libraries of ready-to-use vector stencils that help create Interactive Voice Response (IVR) diagrams illustrating in details a work of interactive voice response system, the IVR system’s logical and physical structure, Voice-over-Internet Protocol (VoIP) diagrams, and Action VoIP diagrams with representing voice actions on them, to visualize how the computers interact with callers through voice recognition and dual-tone multi-frequency signaling (DTMF) keypad inputs.
Marketing and Sales Organization chart. Organization chart Example

 Basketball
The Basketball Solution extends ConceptDraw DIAGRAM.5 (or later) software with samples, templates, and libraries of vector objects for drawing basketball diagrams, plays schemas, and illustrations. It can be used to make professional looking documents, pre
 Baseball
The Baseball Solution extends ConceptDraw DIAGRAM.5 (or later) software with samples, templates, and libraries of vector objects for drawing baseball diagrams, plays, and illustrations. It can be used to make professional looking documents, presentations,
 Ice Hockey
The Ice Hockey Solution extends the capabilities of ConceptDraw DIAGRAM.5 (or later) with samples, templates, and libraries of vector objects for drawing hockey diagrams, plays schemas, and illustrations. The Ice Hockey Solution can be used to make polishe
 Scatter Diagrams
The Scatter Diagrams solution extends ConceptDraw DIAGRAM functionality with templates, samples, and a library of vector stencils that make construction of a Scatter Plot easy. The Scatter Chart Solution makes it easy to design attractive Scatter Diagrams used in various fields of science, work, and life activities. ConceptDraw DIAGRAM lets you enter the data to the table and construct the Scatter Plot Graph automatically according to these data.
 Mechanical Engineering
This solution extends ConceptDraw DIAGRAM.9 mechanical drawing software (or later) with samples of mechanical drawing symbols, templates and libraries of design elements, for help when drafting mechanical engineering drawings, or parts, assembly, pneumatic,
Scatter Plot

- Professional People Clipart Png
- Business Clipart Png
- Discussion People Png
- Business People Vector Png
- Clipart Image Of Financial Information Clipart
- Institution Png
- Uml Diagram For Financial System
- Business People Clipart
- Post Man Png
- Presentation Clipart | Business People Clipart | Business - Design ...
- People | Cisco People. Cisco icons, shapes, stencils and symbols ...
- Professions - Vector stencils library | Winter Sports Vector Clipart ...
- Arrows - Vector clipart library | Presentation Clipart | Illustration ...
- Business people clipart - Vector stencils library | Business people ...
- Business and Finance | Business and Finance Illustrations ...
- Presentation Clipart | Business People Clipart | Winter Sports Vector ...
- Design elements - Business people | Business people clipart ...
- Sample Finance Business Process
- Business People Clipart | Business people pictograms - Vector ...
- Business People Clipart | Beauty in nature Illustrations and Clipart ...