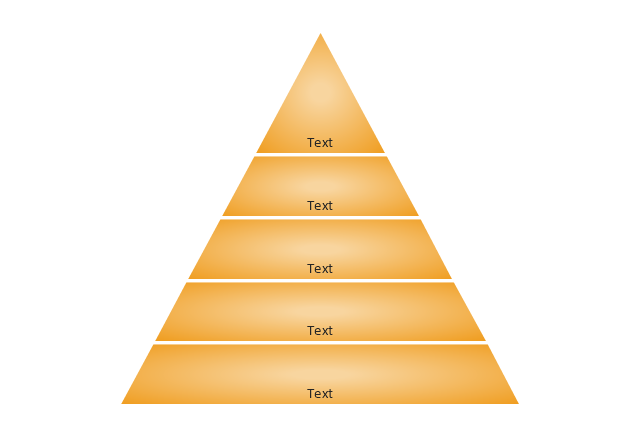
A five level pyramid model of different types of Information Systems based on the information processing requirement of different levels in the organization. The first level represents transaction processing systems to process basic data. The second level represents office support systems to process information in office. The third level represents management information systems to process information by managers. The fourth level represents decision support systems to process explicit knowledge. The fifth level represents executive information systems to process tacit knowledge.
"A Computer(-Based) Information System is essentially an IS using computer technology to carry out some or all of its planned tasks. The basic components of computer based information system are:
(1) Hardware - these are the devices like the monitor, processor, printer and keyboard, all of which work together to accept, process, show data and information.
(2) Software - are the programs that allow the hardware to process the data.
(3) Databases - are the gathering of associated files or tables containing related data.
(4) Networks - are a connecting system that allows diverse computers to distribute resources.
(5) Procedures - are the commands for combining the components above to process information and produce the preferred output.
The first four components (hardware, software, database and network) make up what is known as the information technology platform. Information technology workers could then use these components to create information systems that watch over safety measures, risk and the management of data. These actions are known as information technology services." [Information systems. Wikipedia]
This pyramid diagram was redesigned using the ConceptDraw PRO diagramming and vector drawing software from Wikimedia Commons file Five-Level-Pyramid-model.png. [commons.wikimedia.org/ wiki/ File:Five-Level-Pyramid-model.png]
This file is licensed under the Creative Commons Attribution 3.0 Unported license. [creativecommons.org/ licenses/ by/ 3.0/ deed.en]
The triangle chart example "Information systems types" is included in the Pyramid Diagrams solution from the Marketing area of ConceptDraw Solution Park.
Pyramid diagram

Pyramid Diagram

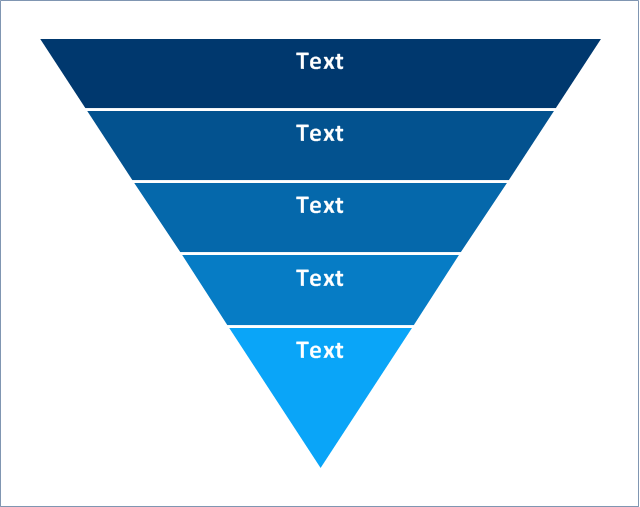
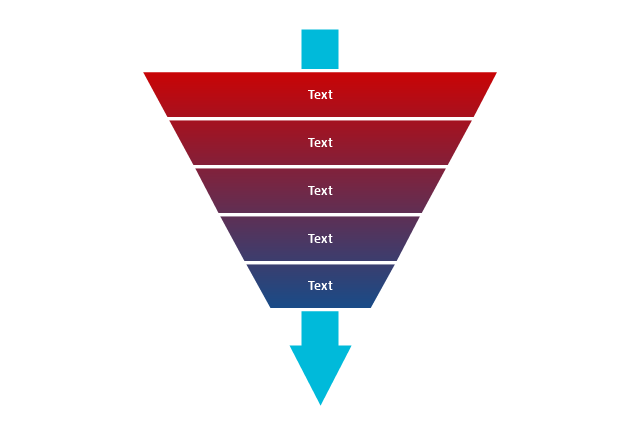
Use this 4-level funnel diagram template to quickly create your own marketing funnel diagrams using the ConceptDraw PRO diagramming and vector drawing software.
The 5-level funnel diagram template is included in the Pyramid Diagrams solution from the Marketing area of ConceptDraw Solution Park.
www.conceptdraw.com/ solution-park/ marketing-pyramid-diagrams
The 5-level funnel diagram template is included in the Pyramid Diagrams solution from the Marketing area of ConceptDraw Solution Park.
www.conceptdraw.com/ solution-park/ marketing-pyramid-diagrams
Funnel diagram
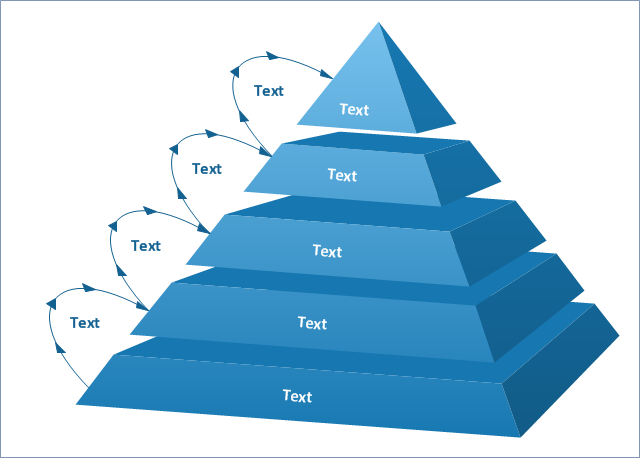
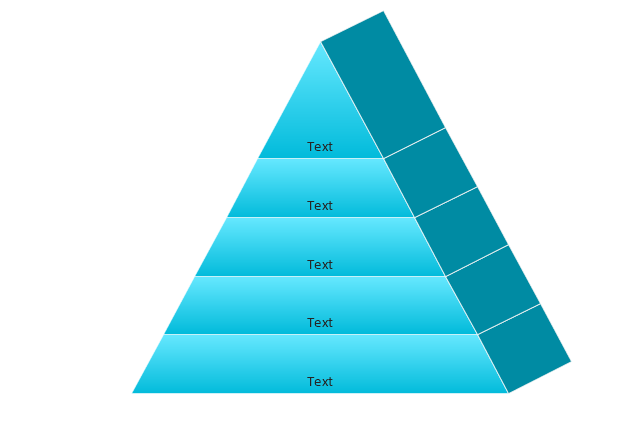
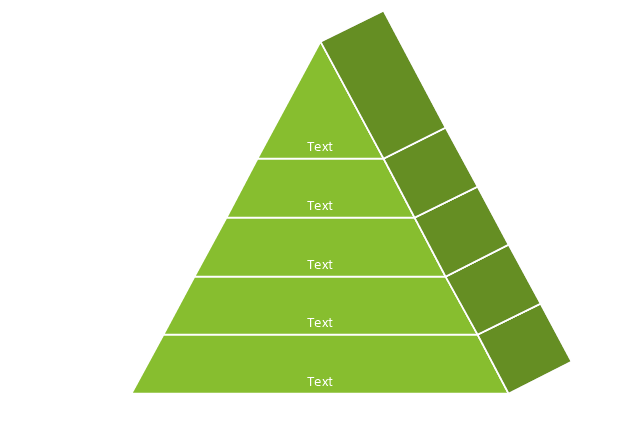
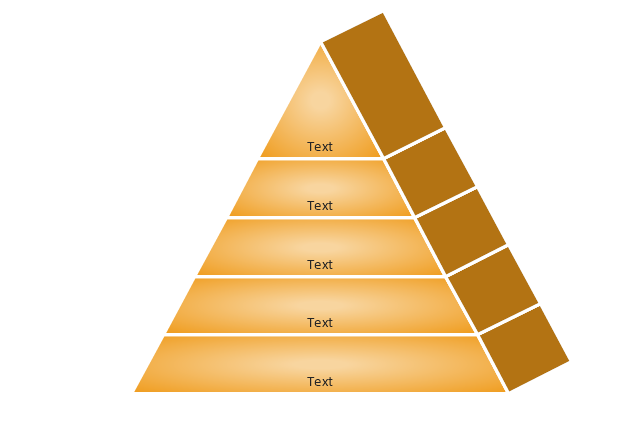
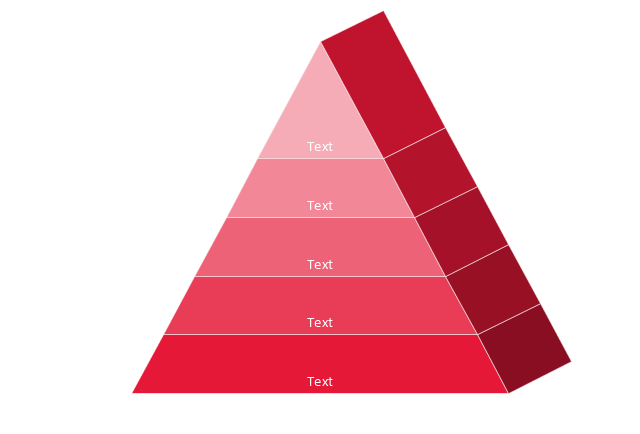
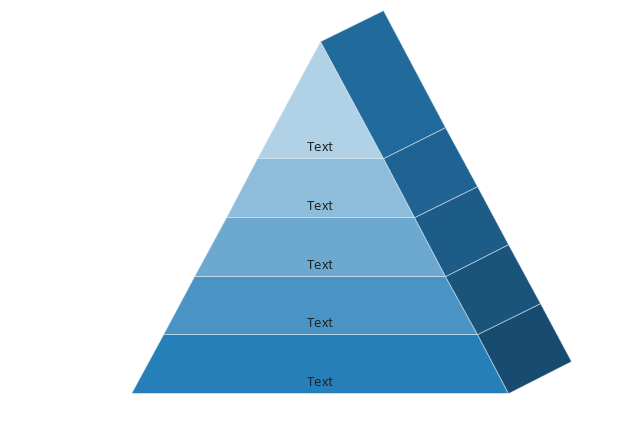
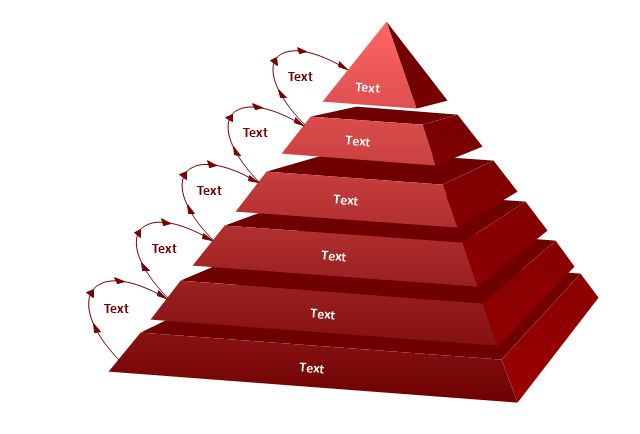
The template "5-Level 3D pyramid diagram" for the ConceptDraw PRO diagramming and vector drawing software is included in the Pyramid Diagrams solution from the Marketing area of ConceptDraw Solution Park.
www.conceptdraw.com/ solution-park/ marketing-pyramid-diagrams
www.conceptdraw.com/ solution-park/ marketing-pyramid-diagrams
Pyramid diagram
The vector stencils library "Pyramid diagrams" contains 28 templates of pyramid diagrams, triangle charts and triangular schemes.
Use these templates to create your pyramid diagrams in the ConceptDraw PRO diagramming and vector drawing software extended with the Pyramid Diagrams solution from the Marketing area of ConceptDraw Solution Park.
Use these templates to create your pyramid diagrams in the ConceptDraw PRO diagramming and vector drawing software extended with the Pyramid Diagrams solution from the Marketing area of ConceptDraw Solution Park.
Pyramid 1
Pyramid 2
Pyramid 3
Pyramid 4
Pyramid 5
Pyramid 1 Isometric
Pyramid 2 Isometric
Pyramid 3 Isometric
Pyramid 4 Isometric
Pyramid 5 Isometric
Triangle diagram, arrows
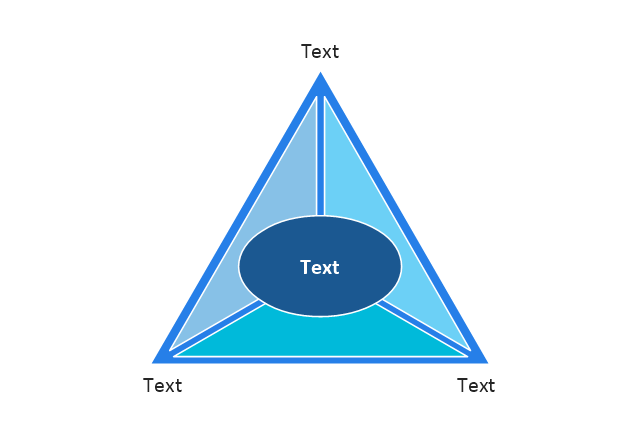
Triangle diagram
Triangular pyramid
Triangular diagram
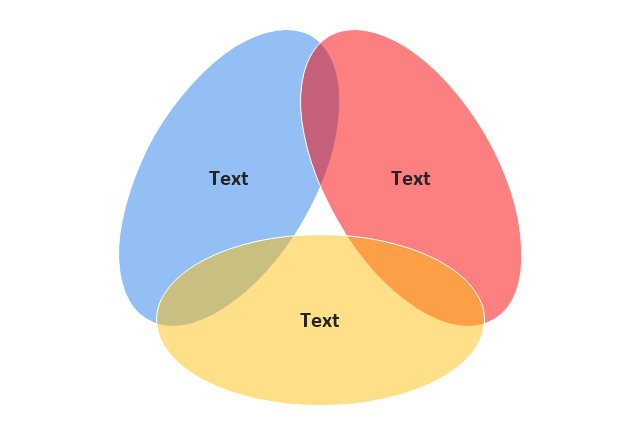
Triangle scheme
Triangle chart

Triangle chart, isometric
Triangular scheme
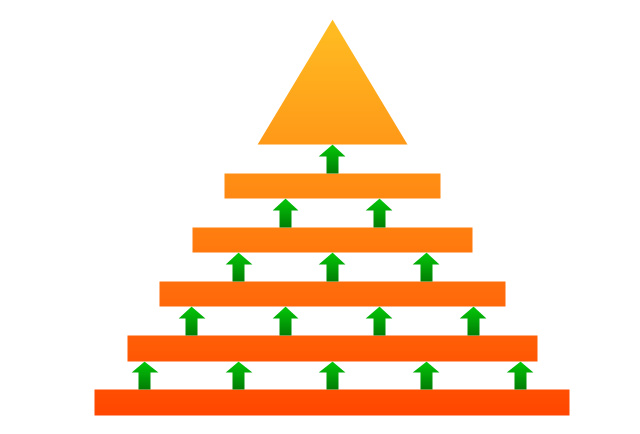
Arrowed block pyramid
Funnel diagram
3-level funnel diagram
4-level funnel diagram
5-level funnel diagram
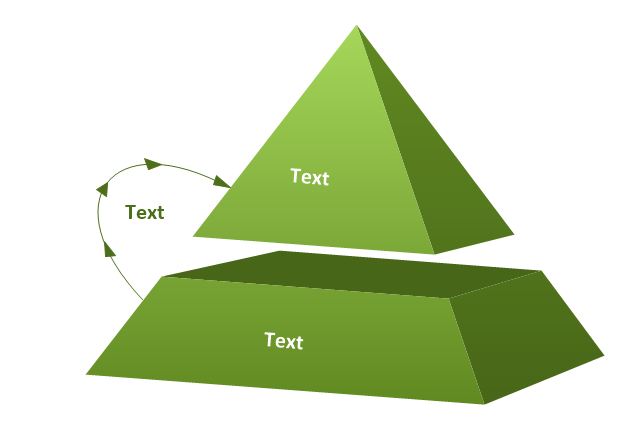
2-level pyramid diagram
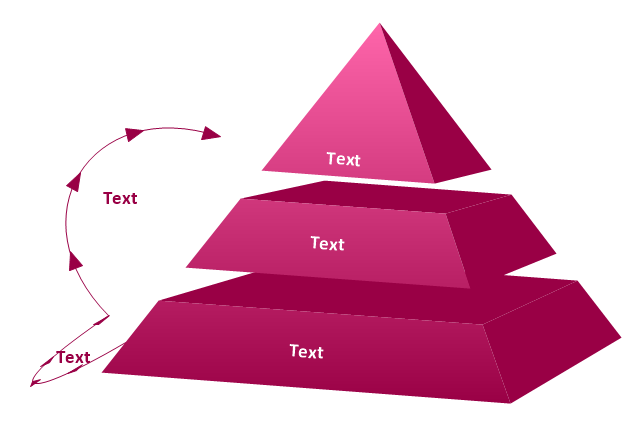
3-level pyramid diagram
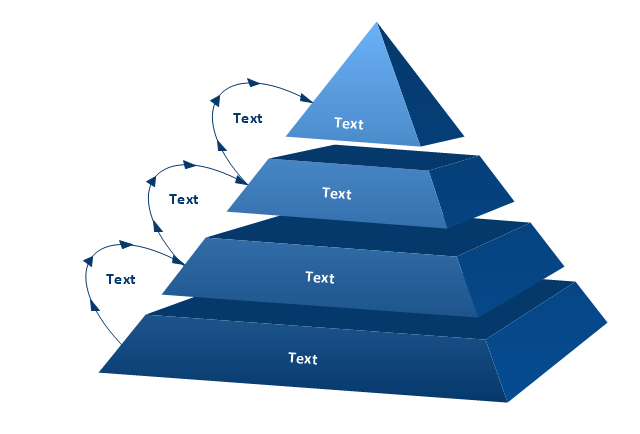
4-level pyramid diagram
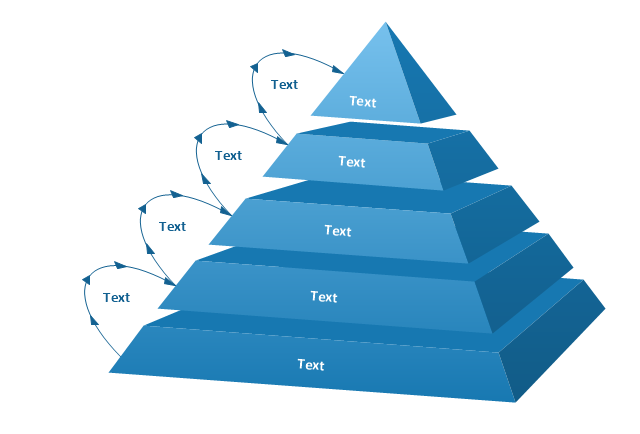
5-level pyramid diagram
6-level pyramid diagram
Pyramid Diagram and Pyramid Chart

 Pyramid Diagrams
Pyramid Diagrams solution extends ConceptDraw DIAGRAM software with templates, samples and library of vector stencils for drawing the marketing pyramid diagrams.
Pyramid Charts

Data Flow Diagram

Pyramid Diagram

Pyramid Chart Examples

HelpDesk
How to Draw a Pyramid Diagram

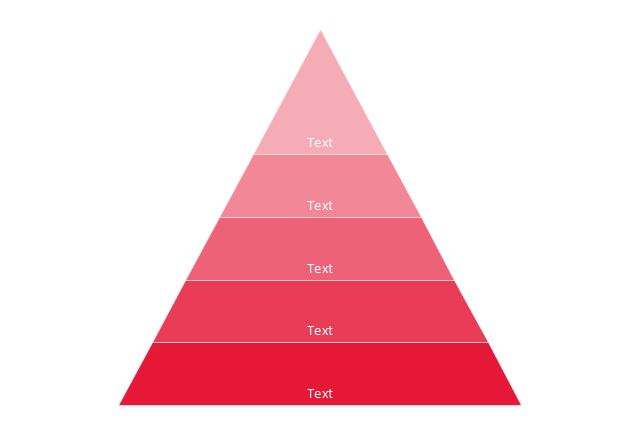
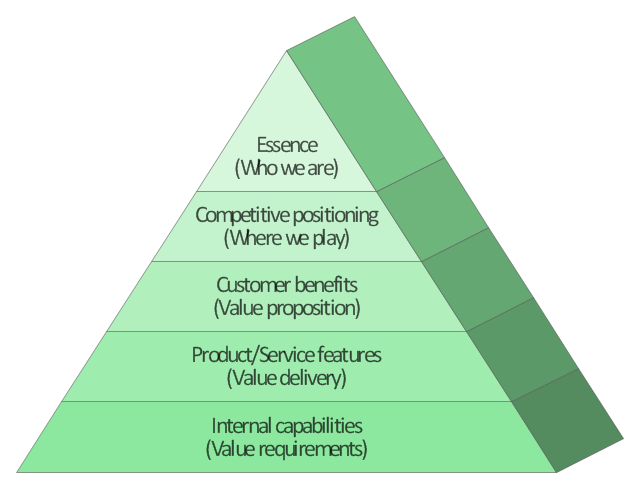
This market value pyramid diagram has 5 levels:
1) Essence (Who we are),
2) Competitive positioning (Where we play),
3) Customer benefits (Value proposition),
4) Product / Service features (Value delivery),
5) Internal capabilitiea (Value requirements).
Use this triangular scheme to develop your marketing strategy.
"Market value or OMV (Open Market Valuation) is the price at which an asset would trade in a competitive auction setting. Market value is often used interchangeably with open market value, fair value or fair market value, although these terms have distinct definitions in different standards, and may differ in some circumstances." [Market value. Wikipedia]
The triangle chart example "Market value" was created using the ConceptDraw PRO diagramming and vector drawing software extended with the Pyramid Diagrams solution from the Marketing area of ConceptDraw Solution Park.
Pyramid diagram
How to Create a Pyramid Diagram

Pyramid Diagram

- 4 Level pyramid model diagram - Information systems types | 5 Level ...
- Pyramid Diagram | 5 Level pyramid model diagram - Information ...
- 5 Level pyramid model diagram - Information systems types | 4 Level ...
- 5 Level pyramid model diagram - Information systems types | Cbis ...
- 5 - level funnel diagram - Template
- 5 Level pyramid model diagram - Information systems types
- 4 Level pyramid model diagram - Information systems types ...
- 5 - Level 3D pyramid diagram - Template
- 5 Level pyramid model diagram - Information systems types | Data ...
- Process Flowchart | 5 Level pyramid model diagram - Information ...
- 5 Level pyramid model diagram - Information systems types
- 5 -Set Venn diagram - Template | 5 Level pyramid model diagram ...
- Pyramid Diagram | Pyramid Diagram | 5 Level pyramid model ...
- UML Diagram | 5 Level pyramid model diagram - Information ...
- Data Flow Diagram | Data Flow Diagrams | 5 Level pyramid model ...
- Pyramid Diagram | Pyramid Diagrams | 5 Level pyramid model ...
- Process Flowchart | Pyramid Diagram | 5 Level pyramid model ...
- 5 Level pyramid model diagram - Information systems types | Design ...
- Pyramid Diagram | 5 Level pyramid model diagram - Information ...
- Data Flow Diagram | 5 Level pyramid model diagram - Information ...