A five level pyramid model of different types of Information Systems based on the information processing requirement of different levels in the organization. The first level represents transaction processing systems to process basic data. The second level represents office support systems to process information in office. The third level represents management information systems to process information by managers. The fourth level represents decision support systems to process explicit knowledge. The fifth level represents executive information systems to process tacit knowledge.
"A Computer(-Based) Information System is essentially an IS using computer technology to carry out some or all of its planned tasks. The basic components of computer based information system are:
(1) Hardware - these are the devices like the monitor, processor, printer and keyboard, all of which work together to accept, process, show data and information.
(2) Software - are the programs that allow the hardware to process the data.
(3) Databases - are the gathering of associated files or tables containing related data.
(4) Networks - are a connecting system that allows diverse computers to distribute resources.
(5) Procedures - are the commands for combining the components above to process information and produce the preferred output.
The first four components (hardware, software, database and network) make up what is known as the information technology platform. Information technology workers could then use these components to create information systems that watch over safety measures, risk and the management of data. These actions are known as information technology services." [Information systems. Wikipedia]
This pyramid diagram was redesigned using the ConceptDraw PRO diagramming and vector drawing software from Wikimedia Commons file Five-Level-Pyramid-model.png. [commons.wikimedia.org/ wiki/ File:Five-Level-Pyramid-model.png]
This file is licensed under the Creative Commons Attribution 3.0 Unported license. [creativecommons.org/ licenses/ by/ 3.0/ deed.en]
The triangle chart example "Information systems types" is included in the Pyramid Diagrams solution from the Marketing area of ConceptDraw Solution Park.
Pyramid diagram

 HR Flowcharts
Human resource management diagrams show recruitment models, the hiring process and human resource development of human resources.
The vector stencils library "Fault tree analysis diagrams" contains 12 symbols for drawing Fault Tree Analysis (FTA) diagrams.
"Fault tree analysis (FTA) is a top down, deductive failure analysis in which an undesired state of a system is analyzed using Boolean logic to combine a series of lower-level events. This analysis method is mainly used in the fields of safety engineering and reliability engineering to understand how systems can fail, to identify the best ways to reduce risk or to determine (or get a feeling for) event rates of a safety accident or a particular system level (functional) failure. FTA is used in the aerospace, nuclear power, chemical and process, pharmaceutical, petrochemical and other high-hazard industries; but is also used in fields as diverse as risk factor identification relating to social service system failure.
In aerospace, the more general term "system Failure Condition" is used for the "undesired state" / Top event of the fault tree. These conditions are classified by the severity of their effects. The most severe conditions require the most extensive fault tree analysis. These "system Failure Conditions" and their classification are often previously determined in the functional Hazard analysis." [Fault tree analysis. Wikipedia]
The shapes example "Fault tree analysis diagrams" was created using the ConceptDraw PRO diagramming and vector drawing software extended with the Fault Tree Analysis Diagrams solution from the Engineering area of ConceptDraw Solution Park.
FTA diagram symbols

This example was redesigned from the Wikimedia Commons file: Example of High Level Fault Tree.jpg. [commons.wikimedia.org/ wiki/ File:Example_ of_ High_ Level_ Fault_ Tree.jpg]
"Risk assessment is the determination of quantitative or qualitative value of risk related to a concrete situation and a recognized threat (also called hazard). Quantitative risk assessment requires calculations of two components of risk (R):, the magnitude of the potential loss (L), and the probability (p) that the loss will occur. Acceptable risk is a risk that is understood and tolerated usually because the cost or difficulty of implementing an effective countermeasure for the associated vulnerability exceeds the expectation of loss.
In all types of engineering of complex systems sophisticated risk assessments are often made within Safety engineering and Reliability engineering when it concerns threats to life, environment or machine functioning. The nuclear, aerospace, oil, rail and military industries have a long history of dealing with risk assessment. Also, medical, hospital, social service and food industries control risks and perform risk assessments on a continual basis. Methods for assessment of risk may differ between industries and whether it pertains to general financial decisions or environmental, ecological, or public health risk assessment." [Risk assessment. Wikipedia]
The FTA diagram example "High level fault tree" was created using the ConceptDraw PRO diagramming and vector drawing software extended with the Fault Tree Analysis Diagrams solution from the Engineering area of ConceptDraw Solution Park.
FTA diagram

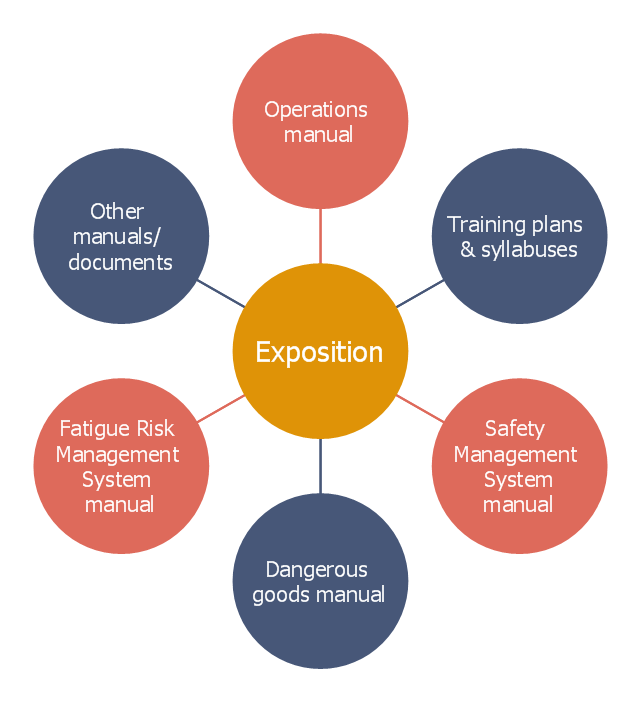
This circle-spoke diagram example was crated on the base of the illustration in the article "What is an exposition?" from the Civil Aviation Safety Authority (CASA) website.
"As the aviation industry transitions to new rules and safety standards through regulatory reform, organisations will be required to demonstrate to the Civil Aviation Safety Authority (CASA) how they have met the requirements outlined in the legislation, including the regulations and manual of standards applicable to their operation through a document called an exposition.
An exposition is a description of how organisations will conduct their operations to maintain the required level of safety. The exposition is the primary document, supported by a series of manuals, such as the operations manual and safety management system manual. These manuals and other supporting documents form part of the exposition document set, as shown in the ... diagram." [casa.gov.au/ scripts/ nc.dll?WCMS:STANDARD::pc=PC_ 101706]
The hub-and-spoke diagram example "CASA exposition" was created using the ConceptDraw PRO diagramming and vector drawing software extended with the Circle-Spoke Diagrams solution from the area "What is a Diagram" of ConceptDraw Solution Park.
Circle-spoke diagram
Network Diagram Software Topology Network


 Rapid UML
Rapid UML solution extends ConceptDraw PRO software with templates, samples and libraries of vector stencils for quick drawing the UML diagrams using Rapid Draw technology.
HelpDesk
How to Create a Fault Tree Analysis Diagram (FTD) in ConceptDraw PRO

 Pyramid Diagrams
Pyramid Diagrams solution extends ConceptDraw PRO software with templates, samples and library of vector stencils for drawing the marketing pyramid diagrams.
- Level Diagram Structure Of Safety Department
- Level Diagram Of Structure And Function Of Safety Department
- Level Diagram Structure Ofsafety Department
- Safety Engineering Analysis
- Leval Diagram Of Safety Departmwnt
- Safety Pyramid Diagram
- Department Of Hospital Block Diagram
- Code fault tree | Preliminary Hazard Analysis
- Safety Tree Diagram
- UML object diagram - Safety inspection | Diagramming Software for ...
- Level Diagram
- Design elements - Fault tree analysis diagrams | Fault Tree Analysis ...
- Safety Fault Tree Analysis Example
- Safety Diagram Best
- 4 Level pyramid model diagram - Information systems types ...
- Pyramid Diagram | Process Flowchart | Pyramid Diagram | Chart Of ...
- Typical Diagram Safety Organizational Chart
- UML Tool & UML Diagram Examples | Personal area (PAN ...
- Getting Departments To Work Together