This site uses cookies. By continuing to browse the ConceptDraw site you are agreeing to our Use of Site Cookies.
"In association football, the formation describes how the players in a team are positioned on the pitch. Different formations can be used depending on whether a team wishes to play more attacking or defensive football. ...
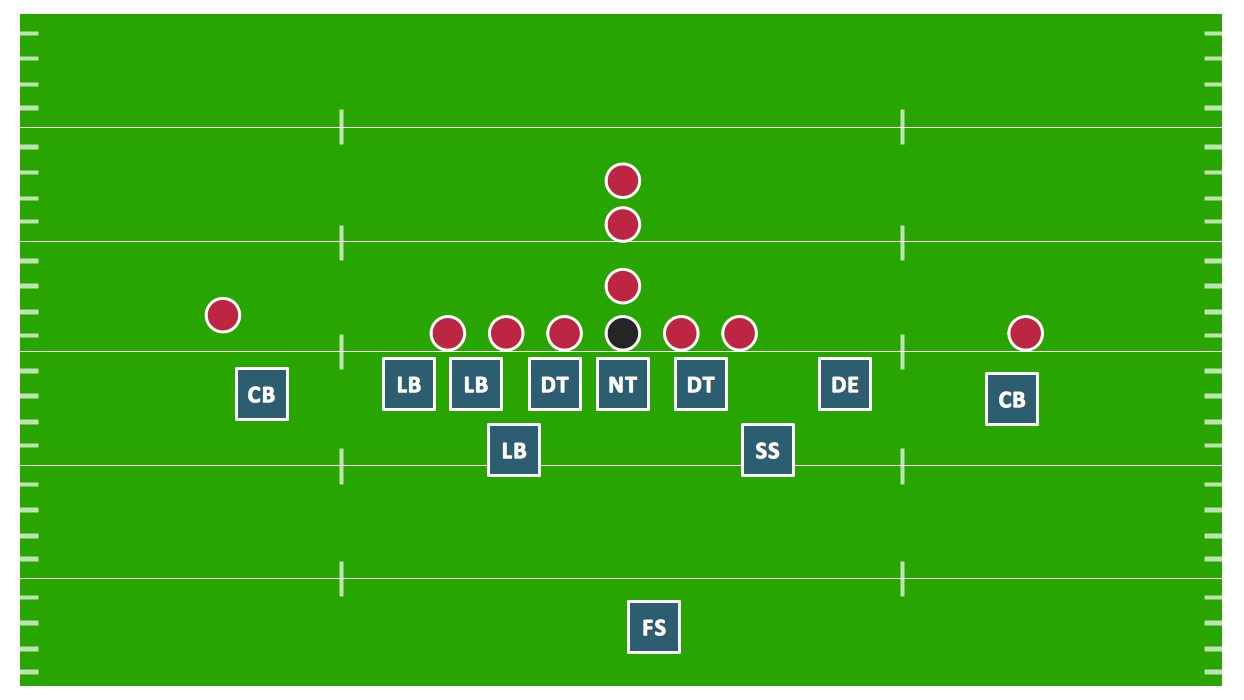
The WM system was created in the mid-1920s by Herbert Chapman of Arsenal to counter a change in the offside law in 1925. The change had reduced the number of opposition players that attackers needed between themselves and the goal-line from three to two. This led to the introduction of a centre-back to stop the opposing centre-forward, and tried to balance defensive and offensive playing. The formation became so successful that by the late-1930s most English clubs had adopted the WM. Retrospectively, the WM has either been described as a 3–2–5 or as a 3–4–3, or more precisely a 3–2–2–3 reflecting the letters which symbolised it. The gap in the centre of the formation between the two wing halves and the two inside forwards allowed Arsenal to counter-attack effectively. The W-M was subsequently adapted by several English sides, but none could apply it in quite the same way Chapman had. This was mainly due to the comparative rarity of Alex James in the English game. He was one of the earliest playmakers in the history of the game, and the hub around which Chapman's Arsenal revolved." [Formation (association football). Wikipedia]
The diagram example "Association football (soccer) formation 3-2-5 (WM)" was created using the ConceptDraw PRO diagramming and vector drawing software extended with the Football solution from the Sport area of ConceptDraw Solution Park.
www.conceptdraw.com/ solution-park/ sport-soccer
Association football (soccer) formation diagram
Association football  (soccer) formation diagram, midfielder, wide midfield, right midfield, midfielder, wide midfield, left midfield, left wing, midfielder, centre midfield, goalkeeper, end zone view football field, end zone view soccer field, defender, right-back, full-backs, defender, left-back, full-backs,
Used Solutions

Process Flowchart

The main reason of using Process Flowchart or PFD is to show relations between major parts of the system. Process Flowcharts are used in process engineering and chemical industry where there is a requirement of depicting relationships between major components only and not include minor parts. Process Flowcharts for single unit or multiple units differ in their structure and implementation. ConceptDraw DIAGRAM is Professional business process mapping software for making Process flowcharts, Process flow diagram, Workflow diagram, flowcharts and technical illustrations for business documents and also comprehensive visio for mac application. Easier define and document basic work and data flows, financial, production and quality management processes to increase efficiency of your business with ConcepDraw DIAGRAM. Business process mapping software with Flowchart Maker ConceptDraw DIAGRAM includes extensive drawing tools, rich examples and templates, process flowchart symbols and shape libraries, smart connectors that allow you create the flowcharts of complex processes, process flow diagrams, procedures and information exchange. Process Flowchart Solution is project management workflow tools which is part ConceptDraw Project marketing project management software. Drawing charts, diagrams, and network layouts has long been the monopoly of Microsoft Visio, making Mac users to struggle when needing such visio alternative like visio for mac, it requires only to view features, make a minor edit to, or print a diagram or chart. Thankfully to MS Visio alternative like ConceptDraw DIAGRAM software, this is cross-platform charting and business process management tool, now visio alternative for making sort of visio diagram is not a problem anymore however many people still name it business process visio tools.
How To Create a Process Flow Chart (business process modelling techniques)

Types of Flowcharts

A Flowchart is a graphical representation of process, algorithm, workflow or step-by-step solution of the problem. It shows the steps as boxes of various kinds and connects them by arrows in a defined order depicting a flow. There are twelve main Flowchart types: Basic Flowchart, Business Process Modeling Diagram (BPMN), Cross Functional Flowchart, Data Flow Diagram (DFD), IDEF (Integrated DEFinition) Flowchart, Event-driven Process Chain (EPC) Diagram, Influence Diagram (ID), Swimlane Flowchart, Process Flow Diagram (PFD), Specification and Description Language (SDL) Diagram, Value Stream Mapping, Workflow Diagram. Using the Flowcharts solution from the Diagrams area of ConceptDraw Solution Park you can easy and quickly design a Flowchart of any of these types. This solution offers a lot of special predesigned vector symbols for each of these widely used notations. They will make the drawing process of Flowcharts much easier than ever. Pay also attention for the included collection of ready Flowchart examples, samples and quick-start templates. This is business process improvement tools. If you are looking for MS Visio for your Mac, then you are out of luck, because it hasn't been released yet. However, you can use Visio alternatives that can successfully replace its functions. ConceptDraw DIAGRAM is an alternative to MS Visio for Mac that provides powerful features and intuitive user interface for the same.
How to Simplify Flow Charting

Defensive Strategy Diagram – 46 Defence

Drawing defensive strategy diagrams using ConceptDraw DIAGRAM software extended with the Football solution saves your time, and adds more value to your work. You can easily convert vector drawing to a popular graphic format and then post it to your blog or site. There is no problem to add your logo or text copyright, or use some text comments to make your diagrams unique and recognizable.

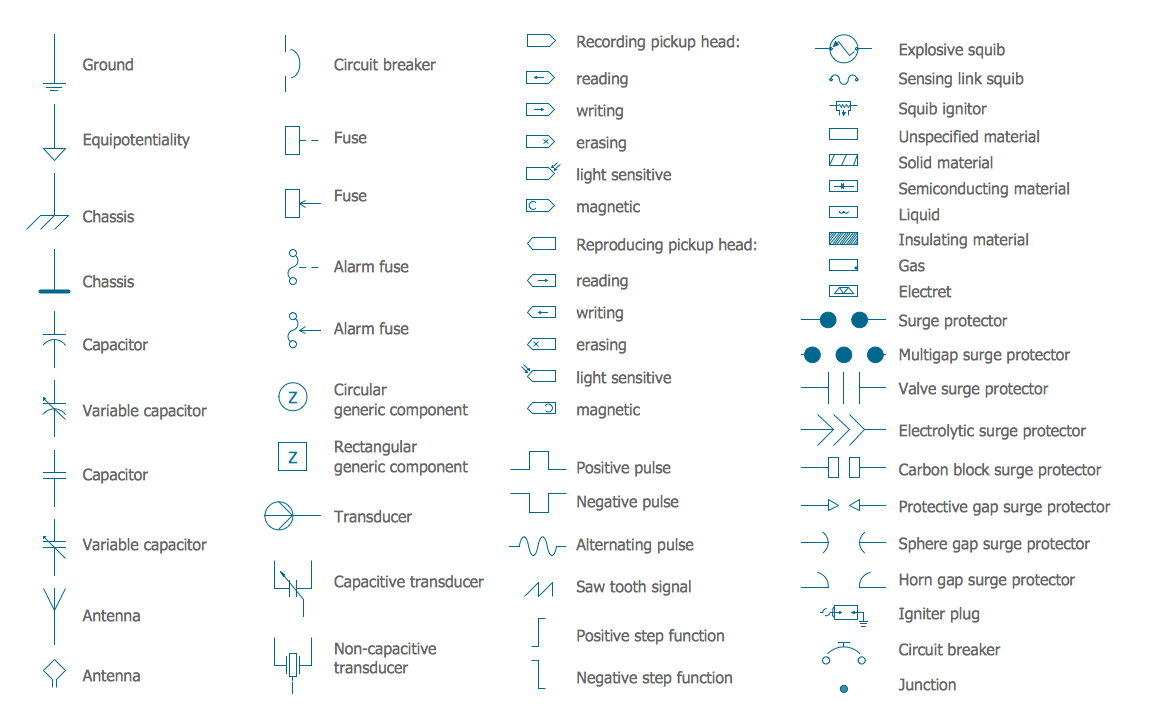
Electrical Symbols, Electrical Diagram Symbols

When drawing Electrical Schematics, Electrical Circuit Diagrams, Power Systems Diagrams, Circuit and Wiring Diagrams, Digital and Analog Logic Schemes, you will obligatory need the electrical symbols and pictograms to represent various electrical and electronic devices, such as resistors, wires, transistors, inductors, batteries, switches, lamps, readouts, amplifiers, repeaters, relays, transmission paths, semiconductors, generators, and many more. Today these symbols are internationally standardized, so the diagrams designed using them are recognizable and comprehensible by specialists from different countries. Electrical Engineering Solution included to ConceptDraw Solution Park provides 26 libraries with 926 commonly used electrical schematic and electrical engineering symbols making the reality the easy drawing of Electrical diagrams, schematics and blueprints. Now you need only a few minutes to create great-looking Electrical diagram, simply choose required electrical design elements from the libraries, drag them on the needed places at the document and connect in a suitable way.

Block Diagram Creator

A block diagram is a diagram of a system in which the principal parts or functions are represented by blocks connected by lines that show the relationships of the blocks. ConceptDraw DIAGRAM diagramming and vector drawing software extended with Block Diagrams Solution from the "Diagrams" Area is a powerful Block Diagram Creator.

Campus Area Networks (CAN). Computer and Network Examples

Campus Area Network (CAN) is a computer network which provides wireless access to the Internet or LAN for the users located in two or more buildings on the limited geographical area, or in the open space surrounding these buildings. Campus Area Network is usually set in campus of a university or college, but the same kind of planning and design can be applied for other purposes, for enterprises, office buildings, military bases, industrial complexes, public places like supermarkets, entertainment centers, etc. Another form of temporary CAN can exist during some special events such as rallies, music festivals. The elementary Campus Area Network can also arise spontaneously, due to the distance of spread the radio signals from the access points that are not limited by buildings walls. It is also sensible to have additional access points for the larger and more complex CANs, located at specially places chosen for serving clients. Design easy diagrams and schemes for the Campus Area Networks with Computer Network Diagrams solution for ConceptDraw DIAGRAM.

scrum, agile methodology, scrum methodology, scrum board Scrum Workflow

scrum, agile methodology, scrum methodology, scrum board
The Scrum Workflow Solution extends the capabilities of ConceptDraw DIAGRAM with a large collection of professionally-designed samples and a selection of ready-to-use scrum design elements: scrum diagrams and arrows, scrum icons of people, artifacts, workflow, workspace and other colorful scrum clipart, and also scrum charts.

systems engineering, sysml SYSML

systems engineering, sysml
The SysML solution helps to present diagrams using Systems Modeling Language; a perfect tool for system engineering.

Electrical Symbols — Electrical Circuits

A circuit diagram or wiring diagram uses symbols to represent parts of a circuit. Electrical and electronic circuits can be complicated. Making a drawing of the connections to all the component parts in the circuit's load makes it easier to understand how circuit components are connected. Drawings for electronic circuits are called "circuit diagrams". Drawings for electrical circuits are called "wiring diagrams". 26 libraries of the Electrical Engineering Solution of ConceptDraw DIAGRAM make your electrical diagramming simple, efficient, and effective. You can simply and quickly drop the ready-to-use objects from libraries into your document to create the electrical diagram.