"Dimensions of service quality.
A customer's expectation of a particular service is determined by factors such as recommendations, personal needs and past experiences. The expected service and the perceived service sometimes may not be equal, thus leaving a gap. The service quality model or the ‘GAP model’ developed by a group of authors- Parasuraman, Zeithaml and Berry at Texas and North Carolina in 1985 , highlights the main requirements for delivering high service quality. It identifies five ‘gaps’ that cause unsuccessful delivery. Customers generally have a tendency to compare the service they 'experience' with the service they 'expect' . If the experience does not match the expectation , there arises a gap. Ten determinants that may influence the appearance of a gap were described by Parasuraman, Zeithaml and Berry. in the SERVQUAL model: reliability, responsiveness, competence, access, courtesy, communication, credibility, security, understanding the customer and tangibles.
Later, the determinants were reduced to five: tangibles; reliability; responsiveness; service assurance and empathy in the so called RATER model." [Service quality. Wikipedia]
The block diagram example "Gap model of service quality" was created using the ConceptDraw PRO diagramming and vector drawing software extended with the Block Diagrams solution from the area "What is a Diagram" of ConceptDraw Solution Park.
Block diagram

"Causes in the diagram are often categorized, such as to ...
The 5 Ss (used in service industry):
(1) Samples;
(2) Scheme;
(3) Synchronous;
(4) Skin;
(5) Search." [Ishikawa diagram. Wikipedia]
This service 4 Ss Ishikawa diagram (cause and effect diagram) template is included in the Fishbone Diagram solution from the Management area of ConceptDraw Solution Park.
4Ss fishbone diagram

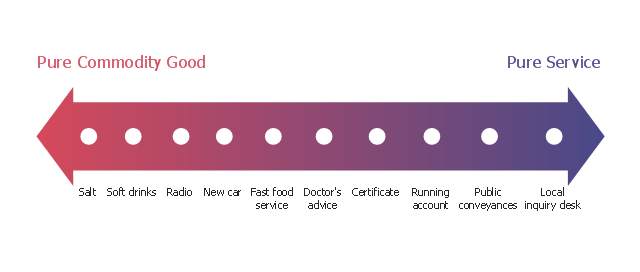
"The dichotomy between physical goods and intangible services is an oversimplification; these are not discrete categories. Most business theorists see a continuum with pure service at one endpoint and pure commodity goods at the other endpoint. Most products fall between these two extremes. Goods are normally structural and can be transferred in an instant while services are delivered over a period of time. Goods can be returned while a service once delivered cannot. Goods are not always tangible and may be virtual." [Goods and services. Wikipedia]
The example "Service-goods continuum diagram" was created using the ConceptDraw PRO diagramming and vector drawing software extended with the Marketing Diagrams solution from the Marketing area of ConceptDraw Solution Park.
The example "Service-goods continuum diagram" was created using the ConceptDraw PRO diagramming and vector drawing software extended with the Marketing Diagrams solution from the Marketing area of ConceptDraw Solution Park.
Service-goods continuum
"A business process or business method is a collection of related, structured activities or tasks that produce a specific service or product (serve a particular goal) for a particular customer or customers. It often can be visualized with a flowchart as a sequence of activities with interleaving decision points or with a Process Matrix as a sequence of activities with relevance rules based on data in the process. ...
There are three types of business processes:
(1) Management processes, the processes that govern the operation of a system. Typical management processes include "corporate governance" and "strategic management".
(2) Operational processes, processes that constitute the core business and create the primary value stream. Typical operational processes are purchasing, manufacturing, advertising and marketing, and sales.
(3) Supporting processes, which support the core processes. Examples include accounting, recruitment, call center, technical support. ...
The ... improvement areas are equally applicable to policies, processes and detailed procedures (sub-processes/ tasks). There is a cascading effect of improvements made at a higher level on those made at a lower level.
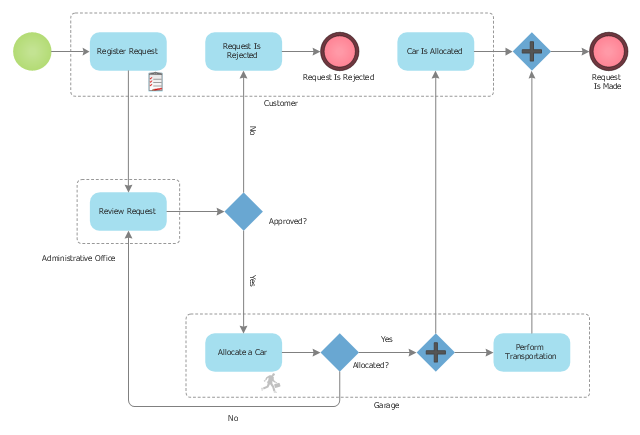
For instance, if a recommendation to replace a given policy with a better one is made with proper justification and accepted in principle by business process owners, then corresponding changes in the consequent processes and procedures will follow naturally in order to enable implementation of the policies" [Business process. Wikipedia]
The BPMN 1.2 (Business Process Model and Notation) diagram example "Taxi service order procedure" was created using the ConceptDraw PRO diagramming and vector drawing software extended with the Business Process Diagram solution from the Business Processes area of ConceptDraw Solution Park.
There are three types of business processes:
(1) Management processes, the processes that govern the operation of a system. Typical management processes include "corporate governance" and "strategic management".
(2) Operational processes, processes that constitute the core business and create the primary value stream. Typical operational processes are purchasing, manufacturing, advertising and marketing, and sales.
(3) Supporting processes, which support the core processes. Examples include accounting, recruitment, call center, technical support. ...
The ... improvement areas are equally applicable to policies, processes and detailed procedures (sub-processes/ tasks). There is a cascading effect of improvements made at a higher level on those made at a lower level.
For instance, if a recommendation to replace a given policy with a better one is made with proper justification and accepted in principle by business process owners, then corresponding changes in the consequent processes and procedures will follow naturally in order to enable implementation of the policies" [Business process. Wikipedia]
The BPMN 1.2 (Business Process Model and Notation) diagram example "Taxi service order procedure" was created using the ConceptDraw PRO diagramming and vector drawing software extended with the Business Process Diagram solution from the Business Processes area of ConceptDraw Solution Park.
Taxi service order procedure - BPMN 1.2 diagram
"Causes in the diagram are often categorized, such as to ...
The 7 Ps (used in marketing industry):
(1) Product/ Service;
(2) Price;
(3) Place;
(4) Promotion;
(5) People/ personnel;
(6) Positioning;
(7) Packaging. " [Ishikawa diagram. Wikipedia]
This 8 Ps Ishikawa diagram (service cause and effect diagram) template is included in the Fishbone Diagram solution from the Management area of ConceptDraw Solution Park.
8Ps fishbone diagram

- Service -goods continuum diagram | How To create Diagrams for ...
- Block diagram - Gap model of service quality | Taxi Service Data ...
- Service 8 Ps fishbone diagram - Template | Fishbone Diagram ...
- Fishbone Diagram Example For Service Industry
- Web Service Diagram
- Business Service Diagram
- Taxi Service Data Flow Diagram DFD Example | Taxi order process ...
- Customer Service Workflow Diagram
- Service -goods continuum diagram | Product Service Continuum ...
- Fishbone Diagrams | Service 4 Ss fishbone diagram - Template ...
- Customer Service Tree Diagram
- Service Process Diagram
- Fishbone Diagram For Customer Service
- Activity Diagram For Car Service App
- Block diagram - Gap model of service quality | Block Diagram ...
- Process Flowchart | Taxi Service Data Flow Diagram DFD Example ...
- Service Request Workflow Diagram
- Taxi Service Data Flow Diagram DFD Example | Taxi service ...
- Service Related Diagrams
- How To create Diagrams for Amazon Web Services architecture ...