"Causes in the diagram are often categorized, such as to ...
The 7 Ps (used in marketing industry):
(1) Product/ Service;
(2) Price;
(3) Place;
(4) Promotion;
(5) People/ personnel;
(6) Positioning;
(7) Packaging. " [Ishikawa diagram. Wikipedia]
This 8 Ps Ishikawa diagram (service cause and effect diagram) template is included in the Fishbone Diagram solution from the Management area of ConceptDraw Solution Park.
8Ps fishbone diagram

 Fishbone Diagram
Fishbone Diagrams solution extends ConceptDraw DIAGRAM software with templates, samples and library of vector stencils for drawing the Ishikawa diagrams for cause and effect analysis.
 Fishbone Diagrams
The Fishbone Diagrams solution extends ConceptDraw DIAGRAM software with the ability to easily draw the Fishbone Diagrams (Ishikawa Diagrams) to clearly see the cause and effect analysis and also problem solving. The vector graphic diagrams produced using this solution can be used in whitepapers, presentations, datasheets, posters, and published technical material.
Fishbone Diagram Template

Create Fishbone Diagrams with the ConceptDraw

Fishbone Diagram Procedure

 Management
This solution extends ConceptDraw DIAGRAM and ConceptDraw MINDMAP with Management Diagrams and Mind Maps (decision making, scheduling, thinking ideas, problem solving, business planning, company organizing, SWOT analysis, preparing and holding meetings
Draw Fishbone Diagram on MAC Software

Fishbone Diagram Example

Fishbone Problem Solving Tool

Fishbone Problem Solving Tool
"Causes in the diagram are often categorized, such as to ...
The 5 Ss (used in service industry):
(1) Samples;
(2) Scheme;
(3) Synchronous;
(4) Skin;
(5) Search." [Ishikawa diagram. Wikipedia]
This service 4 Ss Ishikawa diagram (cause and effect diagram) template is included in the Fishbone Diagram solution from the Management area of ConceptDraw Solution Park.
4Ss fishbone diagram

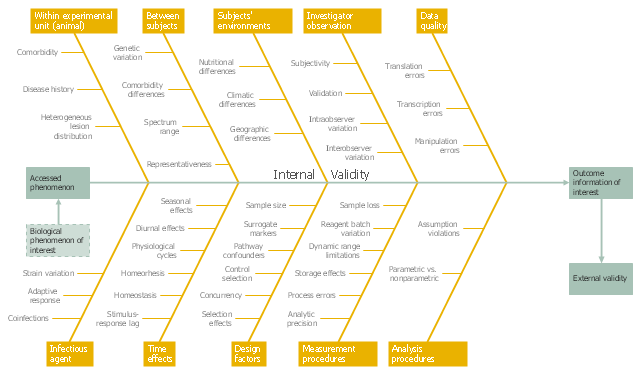
This example was created on the base of the figure from the website of the WSU College of Veterinary Medicine of the Washington State University. [vetmed.wsu.edu/ courses-jmgay/ images/ Ishikawa%20 Variance%20 Diagram.jpg]
"Internal validity is a property of scientific studies which reflects the extent to which a causal conclusion based on a study is warranted. Such warrant is constituted by the extent to which a study minimizes systematic error (or 'bias')." [Internal validity. Wikipedia]
The fishbone diagram example "Ishikawa variance diagram" was created using the ConceptDraw PRO diagramming and vector drawing software extended with the Fishbone Diagrams solution from the Management area of ConceptDraw Solution Park.
Ishikawa diagram
Communication Tool for Remote Project Management

TQM Software — Build Professional TQM Diagrams

Workflow Diagram

Baseball DiagramBasic Bunt Coverage – Runner at 2nd

 Economy Infographics
The Economy Infographics solution provides a large collection of vector icon libraries, drawing samples and infographic examples for quick and simple design of the best infographics, illustrations, and presentations about economics, markets, economic policy, business, finances, government and social institutions, production, distribution, and consumption of goods and services, economic diagrams and schemes, economic activities designs, continent and country economic maps, economic presentations, market economy and economic system infographic charts, illustrations in economic articles, reports in mass media, and blog posts in social media. It is a valuable tool for wide range of economists, politicians, managers, marketing experts, business analysts, journalists and bloggers focusing on economy, educators and students studying economics, and many other people to communicate visually the economic information.
Near field communication (NFC). Computer and Network Examples
. <br>Computer and Network Examples *")

 Network Layout Floor Plans
Network Layout Floor Plans solution extends ConceptDraw DIAGRAM software functionality with powerful tools for quick and efficient documentation the network equipment and displaying its location on the professionally designed Network Layout Floor Plans. Never before creation of Network Layout Floor Plans, Network Communication Plans, Network Topologies Plans and Network Topology Maps was not so easy, convenient and fast as with predesigned templates, samples, examples and comprehensive set of vector design elements included to the Network Layout Floor Plans solution. All listed types of plans will be a good support for the future correct cabling and installation of network equipment.
- Service 8 Ps fishbone diagram - Template | Create Fishbone ...
- Service 8 Ps fishbone diagram template | Business Processes Area ...
- Fishbone Diagram | Fishbone Diagrams | Service 8 Ps fishbone ...
- Fishbone Diagrams | Fishbone Diagram | Service 8 Ps fishbone ...
- Fishbone Diagrams - Template | Service 8 Ps fishbone diagram
- Service 4 Ss fishbone diagram - Template | Service 8 Ps fishbone ...
- Fishbone Diagram | Management | Word Exchange | 8 Ps Of Quality
- Service 8 Ps fishbone diagram - Template | How Do Fishbone ...
- Service 8 Ps fishbone diagram - Template | Service 4 Ss fishbone ...