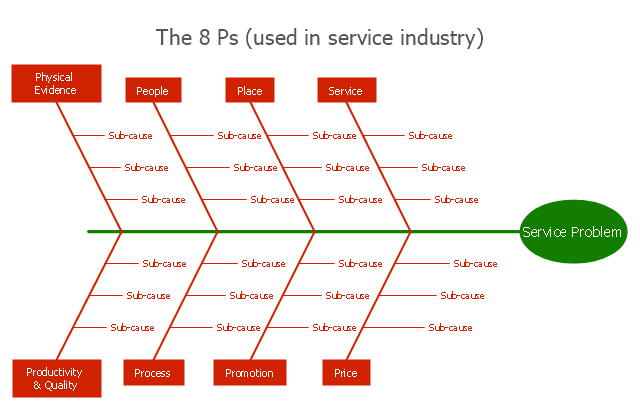
"Causes in the diagram are often categorized, such as to ...
The 7 Ps (used in marketing industry):
(1) Product/ Service;
(2) Price;
(3) Place;
(4) Promotion;
(5) People/ personnel;
(6) Positioning;
(7) Packaging. " [Ishikawa diagram. Wikipedia]
This 8 Ps Ishikawa diagram (service cause and effect diagram) template is included in the Fishbone Diagram solution from the Management area of ConceptDraw Solution Park.
Create Fishbone Diagrams with the ConceptDraw
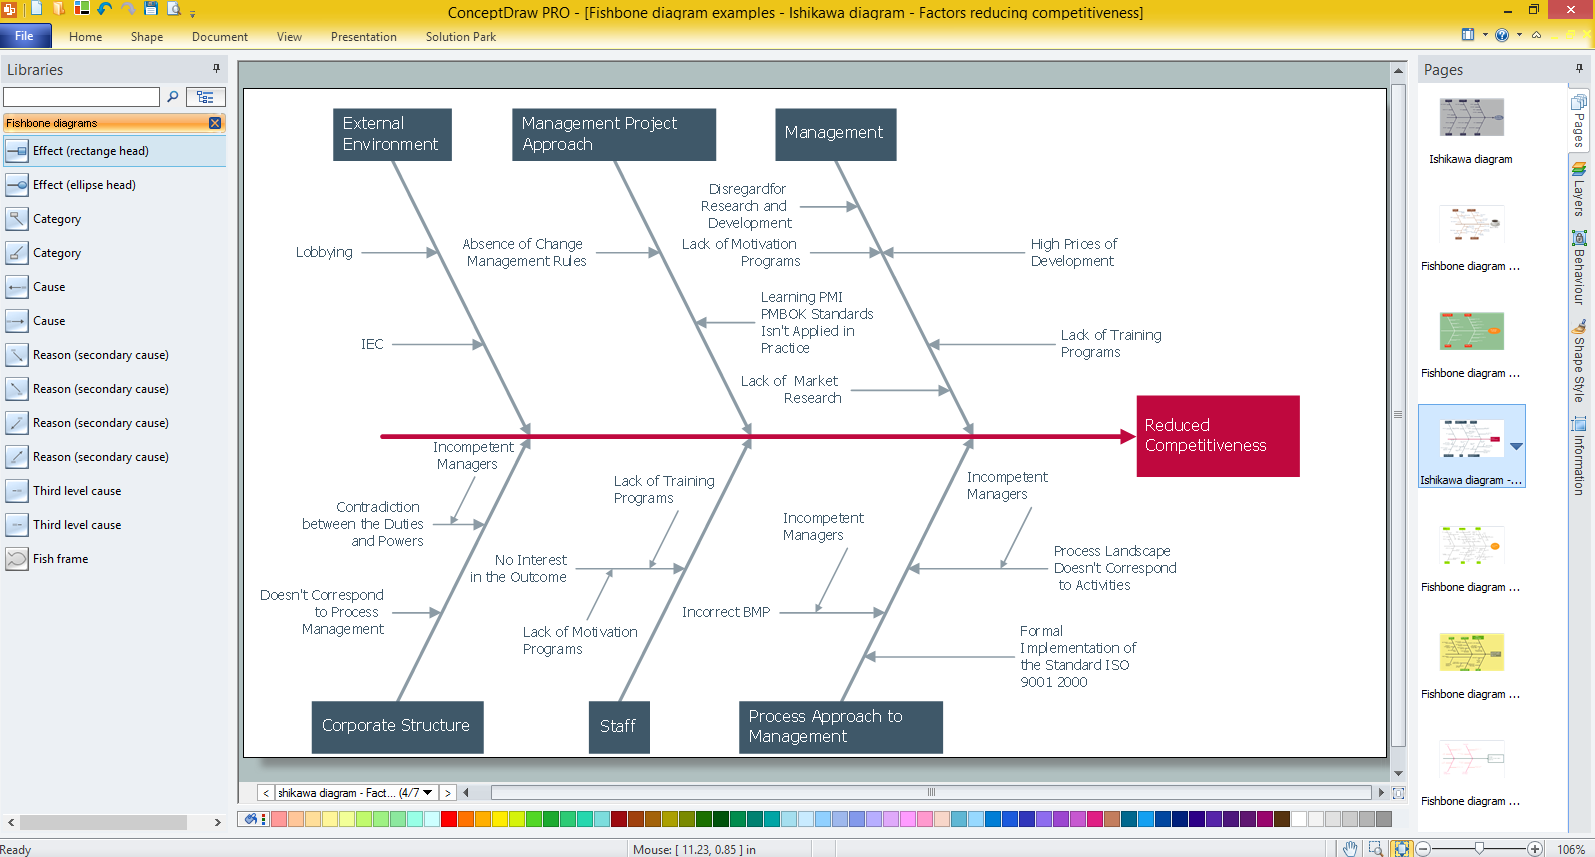
ConceptDraw DIAGRAM has the powerful tools for rapid drawing Fishbone diagrams and identifying many possible causes for an effect for problem solving. Causes can be grouped into major categories to identify these sources of variation. Easy create Fishbone diagrams with the ConceptDraw DIAGRAM software and Fishbone Diagrams solution included to ConceptDraw Solution Park!Fishbone Diagram Procedure
ConceptDraw DIAGRAM diagramming and vector drawing software enhanced with Fishbone Diagrams solution from the Management area of ConceptDraw Solution Park gives the ability to draw Fishbone diagram, which identifies many possible causes for an effect for problem solving. Fishbone Diagram procedure of creation includes the set of steps easy for execution in ConceptDraw DIAGRAM.Improving Problem Solving and Focus with Fishbone Diagrams
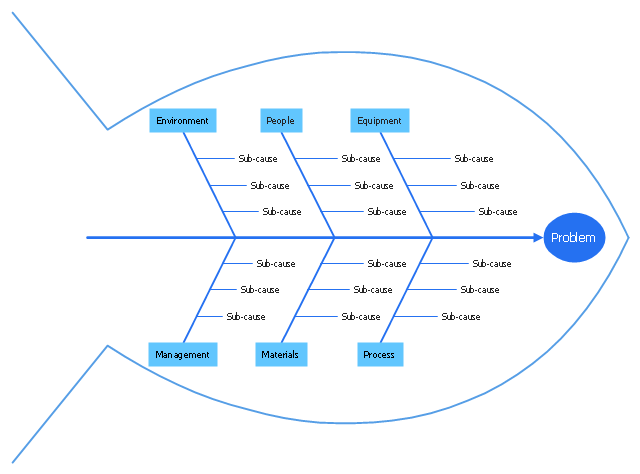
When you need to focus on the problem, professional diagramming tool helps you create a Fishbone diagram also known as Ishikawa diagram. Understanding of the problem via Fishbone diagram will improve the processes between departments and teams. ConceptDraw DIAGRAM extended with Fishbone Diagrams solution gives a powerful tool for improving problem solving and focus with Fishbone diagrams."Common uses of the Ishikawa diagram are product design and quality defect prevention, to identify potential factors causing an overall effect. Each cause or reason for imperfection is a source of variation. Causes are usually grouped into major categories to identify these sources of variation. The categories typically include:
(1) People: Anyone involved with the process;
(2) Methods: How the process is performed and the specific requirements for doing it, such as policies, procedures, rules, regulations and laws;
(3) Machines: Any equipment, computers, tools, etc. required to accomplish the job;
(4) Materials: Raw materials, parts, pens, paper, etc. used to produce the final product;
(5) Measurements: Data generated from the process that are used to evaluate its quality;
(6) Environment: The conditions, such as location, time, temperature, and culture in which the process operates. ...
Ishikawa diagrams were popularized by Kaoru Ishikawa in the 1960s, who pioneered quality management processes in the Kawasaki shipyards, and in the process became one of the founding fathers of modern management.
The basic concept was first used in the 1920s, and is considered one of the seven basic tools of quality control." [Ishikawa diagram. Wikipedia]
This quality Ishikawa diagram (cause and effect diagram) template is included in the Fishbone Diagram solution from the Management area of ConceptDraw Solution Park.
Sales Process Steps
Sales process engineering is a complex and labour-intensive process which requires a lot of time, efforts, and powerful software. We recommend to use the ConceptDraw DIAGRAM software enhanced with Sales Flowcharts solution from the Marketing area of ConceptDraw Solution Park. It gives the possibility to easy illustrate all sales process steps and their results.Value Stream Diagram
The new Value Stream Mapping solution found in the ConceptDraw Solution Park continues to extend the range of ConceptDraw DIAGRAM into a business graphics tool.Customer Relationship Management
Customer relationship management is an important component of sales success. Visualizing sales data you may put some KPI related to customers relationship management to your Sales dashboard and track this important aspect in real time.
 Marketing Diagrams
Marketing Diagrams solution extends ConceptDraw DIAGRAM diagramming software with abundance of samples, templates and vector design elements intended for easy graphical visualization and drawing different types of Marketing diagrams and graphs, including Branding Strategies Diagram, Five Forces Model Diagram, Decision Tree Diagram, Puzzle Diagram, Step Diagram, Process Chart, Strategy Map, Funnel Diagram, Value Chain Diagram, Ladder of Customer Loyalty Diagram, Leaky Bucket Diagram, Promotional Mix Diagram, Service-Goods Continuum Diagram, Six Markets Model Diagram, Sources of Customer Satisfaction Diagram, etc. Analyze effectively the marketing activity of your company and apply the optimal marketing methods with ConceptDraw DIAGRAM software.
 Landscape & Garden
The Landscape and Gardens solution for ConceptDraw DIAGRAM is the ideal drawing tool when creating landscape plans. Any gardener wondering how to design a garden can find the most effective way with Landscape and Gardens solution.
 Building Design Package
Architects and building engineers to develop building documentation, floor plans and building blueprints, to help designers depict bright and innovative design solutions, make beautiful design proposals and represent the most daring design ideas, to communicate ideas and concepts that relate to construction and design, explain requirements to a building contractor and builders, record completed work, and make a record of what currently exists.
- Service 8 Ps fishbone diagram - Template | Fishbone Diagram ...
- Root Cause Analysis Fishbone With 6 Ps
- Service 8 Ps fishbone diagram - Template | Fishbone Diagram ...
- Fishbone Diagram | Fishbone Diagrams | Service 8 Ps fishbone ...
- Fishbone Diagram | Service 8 Ps fishbone diagram - Template ...
- Fishbone Diagrams | Fishbone Diagram | Service 8 Ps fishbone ...
- Fishbone Diagram | Management | Word Exchange | 8 Ps Of Quality
- Fishbone Diagrams | Service 4 Ss fishbone diagram - Template ...
- Fishbone Diagrams | Fault Tree Analysis Diagrams | Chemical ...
- Positioning map | Competitor Analysis | Service 8 Ps fishbone ...
- Service 8 Ps fishbone diagram template | Business Processes Area ...
- Fishbone Diagrams | Draw Fishbone Diagram on MAC Software ...
- Fishbone Diagrams | Service 4 Ss fishbone diagram - Template ...
- Manufacturing 8 Ms fishbone diagram - Template | Fishbone ...
- Manufacturing 8 Ms fishbone diagram - Template | Quality fishbone ...
- Fishbone diagram - Template | Manufacturing 8 Ms fishbone ...
- Ishikawa fishbone diagram | Fishbone diagram - Bad coffee | Cause ...
- Fishbone Diagram | Design elements - Fishbone diagram ...
- Design elements - Fishbone diagram | Total Quality Management ...


