"Causes in the diagram are often categorized, such as to the 6 M's ...
The 6 Ms (used in manufacturing industry):
(1) Machine (technology);
(2) Method (process);
(3) Material (Includes Raw Material, Consumables and Information.);
(4) Man Power (physical work)/ Mind Power (brain work): Kaizens, Suggestions;
(5) Measurement (Inspection);
(6) Milieu/ Mother Nature (Environment).
The original 6Ms used by the Toyota Production System have been expanded by some to include the following and are referred to as the 8Ms. However, this is not globally recognized. It has been suggested to return to the roots of the tools and to keep the teaching simple while recognizing the original intent; most programs do not address the 8Ms.
(7) Management/ Money Power;
(8) Maintenance." [Ishikawa diagram. Wikipedia]
This 8Ms Ishikawa diagram (manufacturing cause and effect diagram) template is included in the Fishbone Diagram solution from the Management area of ConceptDraw Solution Park.
8Ms Ishikawa diagram

"Cause-and-effect diagrams can reveal key relationships among various variables, and the possible causes provide additional insight into process behavior.
Causes can be derived from brainstorming sessions. These groups can then be labeled as categories of the fishbone. They will typically be one of the traditional categories mentioned above but may be something unique to the application in a specific case. Causes can be traced back to root causes with the 5 Whys technique." [Ishikawa diagram. Wikipedia]
"The 5 Whys is an iterative question-asking technique used to explore the cause-and-effect relationships underlying a particular problem. The primary goal of the technique is to determine the root cause of a defect or problem. (The "5" in the name derives from an empirical observation on the number of iterations typically required to resolve the problem.)" [5 Whys. Wikipedia]
This Ishikawa diagram (cause and effect diagram) template is included in the Fishbone Diagram solution from the Management area of ConceptDraw Solution Park.
Fishbone diagram

The library of vector stencils "Fishbone diagrams" contains 13 symbols for drawing the Ishikawa diagrams using the ConceptDraw PRO diagramming and vector drawing software.
"Ishikawa diagrams were popularized by Kaoru Ishikawa in the 1960s, who pioneered quality management processes in the Kawasaki shipyards, and in the process became one of the founding fathers of modern management.
The basic concept was first used in the 1920s, and is considered one of the seven basic tools of quality control. It is known as a fishbone diagram because of its shape, similar to the side view of a fish skeleton." [Ishikawa diagram. Wikipedia]
"The Seven Basic Tools of Quality is a designation given to a fixed set of graphical techniques identified as being most helpful in troubleshooting issues related to quality. They are called basic because they are suitable for people with little formal training in statistics and because they can be used to solve the vast majority of quality-related issues.
The seven tools are:
(1) Cause-and-effect diagram (also known as the "fishbone" or Ishikawa diagram);
(2) Check sheet;
(3) Control chart;
(4) Histogram;
(5) Pareto chart;
(6) Scatter diagram;
(7) Stratification (alternately, flow chart or run chart)." [Seven Basic Tools of Quality. Wikipedia]
The example "Design elements - Fishbone diagram" is included in the Fishbone Diagrams solution from the Management area of ConceptDraw Solution Park.
Ishikawa diagram symbols

This cause-and-effect diagram example was redesigned from the Wikimedia Commons file: Ishikawa Fishbone Diagram.svg. [commons.wikimedia.org/ wiki/ File:Ishikawa_ Fishbone_ Diagram.svg]
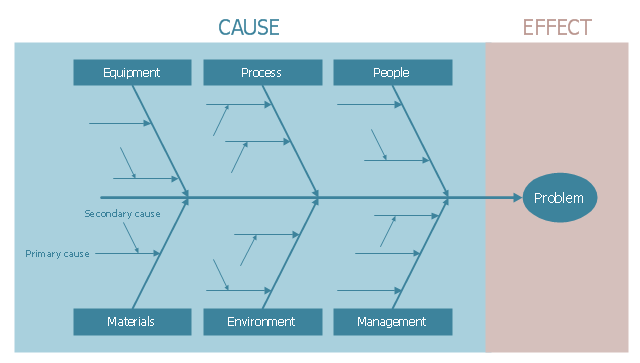
"Ishikawa diagrams (also called fishbone diagrams, herringbone diagrams, cause-and-effect diagrams, or Fishikawa) are causal diagrams created by Kaoru Ishikawa (1968) that show the causes of a specific event. Common uses of the Ishikawa diagram are product design and quality defect prevention to identify potential factors causing an overall effect. Each cause or reason for imperfection is a source of variation. Causes are usually grouped into major categories to identify these sources of variation. The categories typically include
- People: Anyone involved with the process
- Methods: How the process is performed and the specific requirements for doing it, such as policies, procedures, rules, regulations and laws
- Machines: Any equipment, computers, tools, etc. required to accomplish the job
- Materials: Raw materials, parts, pens, paper, etc. used to produce the final product
- Measurements: Data generated from the process that are used to evaluate its quality
- Environment: The conditions, such as location, time, temperature, and culture in which the process operates" [Ishikawa diagram. Wikipedia]
The example "Ishikawa fishbone diagram" was created using the ConceptDraw PRO software extended with the Seven Basic Tools of Quality solution from the Quality area of ConceptDraw Solution Park.
Cause-and-effect diagram example
"Causes in the diagram are often categorized, such as to ...
The 7 Ps (used in marketing industry):
(1) Product/ Service;
(2) Price;
(3) Place;
(4) Promotion;
(5) People/ personnel;
(6) Positioning;
(7) Packaging. " [Ishikawa diagram. Wikipedia]
This 8 Ps Ishikawa diagram (service cause and effect diagram) template is included in the Fishbone Diagram solution from the Management area of ConceptDraw Solution Park.
8Ps fishbone diagram

"Causes in the diagram are often categorized, such as to ...
The 5 Ss (used in service industry):
(1) Samples;
(2) Scheme;
(3) Synchronous;
(4) Skin;
(5) Search." [Ishikawa diagram. Wikipedia]
This service 4 Ss Ishikawa diagram (cause and effect diagram) template is included in the Fishbone Diagram solution from the Management area of ConceptDraw Solution Park.
4Ss fishbone diagram

The vector stencils library "Cause-and-effect diagram" contains 13 elements of fishbone diagram.
Use it to design your Ishikawa diagrams with ConceptDraw PRO diagramming and vector drawing software.
"Ishikawa diagrams (also called fishbone diagrams, herringbone diagrams, cause-and-effect diagrams, or Fishikawa) are causal diagrams created by Kaoru Ishikawa (1968) that show the causes of a specific event. Common uses of the Ishikawa diagram are product design and quality defect prevention to identify potential factors causing an overall effect. Each cause or reason for imperfection is a source of variation. Causes are usually grouped into major categories to identify these sources of variation. ...
The basic concept was first used in the 1920s, and is considered one of the seven basic tools of quality control." [Ishikawa diagram. Wikipedia]
The example of fishbone diagram shapes "Design elements - Cause-and-effect diagram" is included in the Seven Basic Tools of Quality solution from the Quality area of ConceptDraw Solution Park.
Fishbone diagram elements

 Event-driven Process Chain Diagrams
Event-Driven Process Chain Diagrams solution extends ConceptDraw DIAGRAM functionality with event driven process chain templates, samples of EPC engineering and modeling the business processes, and a vector shape library for drawing the EPC diagrams and EPC flowcharts of any complexity. It is one of EPC IT solutions that assist the marketing experts, business specialists, engineers, educators and researchers in resources planning and improving the business processes using the EPC flowchart or EPC diagram. Use the EPC solutions tools to construct the chain of events and functions, to illustrate the structure of a business process control flow, to describe people and tasks for execution the business processes, to identify the inefficient businesses processes and measures required to make them efficient.
This cause and effect diagram sample was redesigned from the Wikimedia Commons file: Ursache Wirkung Diagramm Beispiel.png. [commons.wikimedia.org/ wiki/ File:Ursache_ Wirkung_ Diagramm_ Beispiel.png]
This file is licensed under the Creative Commons Attribution-Share Alike 3.0 Unported license. [creativecommons.org/ licenses/ by-sa/ 3.0/ deed.en]
"Productivity is the ratio of output to inputs in production; it is an average measure of the efficiency of production. Efficiency of production means production’s capability to create incomes which is measured by the formula real output value minus real input value.
Productivity is a crucial factor in production performance of firms and nations. Increasing national productivity can raise living standards because more real income improves people's ability to purchase goods and services, enjoy leisure, improve housing and education and contribute to social and environmental programs. Productivity growth also helps businesses to be more profitable." [Productivity. Wikipedia]
The fishbone diagram example "Increase in productivity" was created using the ConceptDraw PRO diagramming and vector drawing software extended with the Fishbone Diagrams solution from the Management area of ConceptDraw Solution Park.
Ishikawa diagram

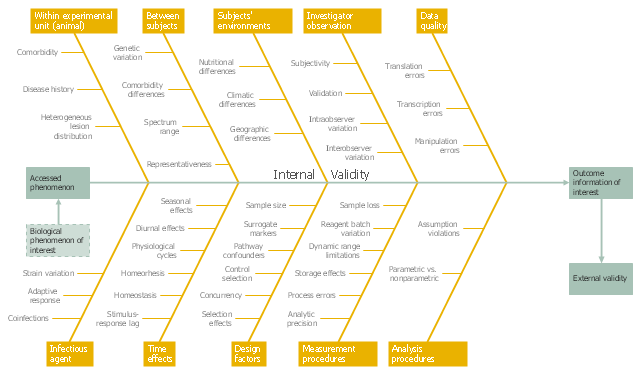
This example was created on the base of the figure from the website of the WSU College of Veterinary Medicine of the Washington State University. [vetmed.wsu.edu/ courses-jmgay/ images/ Ishikawa%20 Variance%20 Diagram.jpg]
"Internal validity is a property of scientific studies which reflects the extent to which a causal conclusion based on a study is warranted. Such warrant is constituted by the extent to which a study minimizes systematic error (or 'bias')." [Internal validity. Wikipedia]
The fishbone diagram example "Ishikawa variance diagram" was created using the ConceptDraw PRO diagramming and vector drawing software extended with the Fishbone Diagrams solution from the Management area of ConceptDraw Solution Park.
Ishikawa diagram
- Wiki Fishbone Diagram
- Interrelationship Diagram Wikipedia
- Fishbone Diagram Wiki
- 4m Analysis Wikipedia
- Entity-Relationship Diagram (ERD) | Money Tree Diagram Wikipedia
- Ishikawa fishbone diagram | Fishbone diagram - Bad coffee | Cause ...
- Cause and effect diagram - Increase in productivity | Fishbone ...
- Fishbone Analysis Wiki
- Pert Diagram Wiki
- Service 8 Ps fishbone diagram - Template | Fishbone Diagram ...