Made with
ConceptDraw
DIAGRAM 18

SWOT Technique

SWOT analysis is a strategic planning and strategic management technique that provides assessment tools. Currently, SWOT technique is popular and widely used. It is applied by businesses to analyze the strengths, weaknesses, opportunities, and threats of the company to assess performance and evaluate its competitive position in the market. It is a way to conduct the company's audit, evaluate the competition, risks, and potential of a business, create a strong development plan, and devise a successful strategy to disclose current and future potential.

SWOT analysis is an indispensable tool in the modern business world. It helps to analyze factors that make a product or service, product line, industry, or company strong or weak, evaluate perspectives, provide new ideas and initiatives to develop and promote a particular business. It uses internal and external data and forces that impact decisions and create certain opportunities or obstacles and risks.

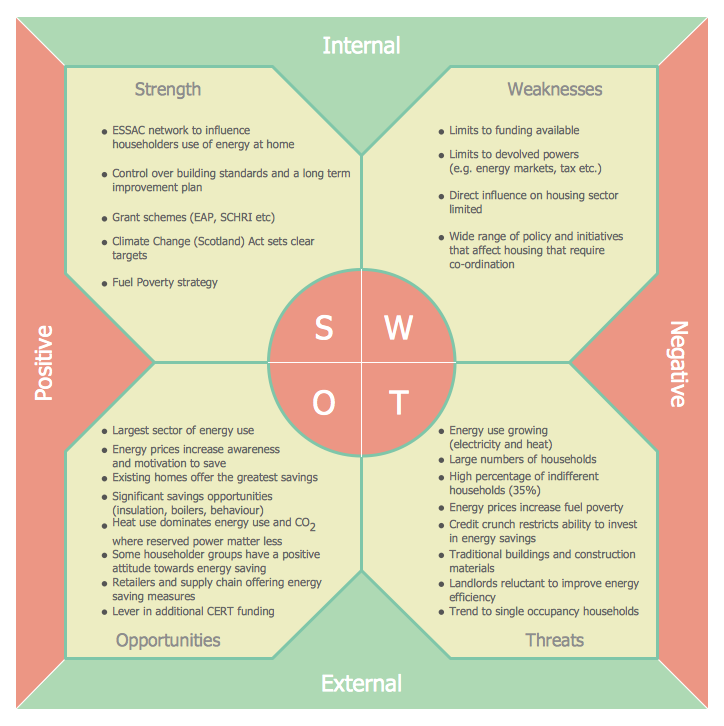
Being based on the strengths, weaknesses, opportunities, and threats, SWOT technique supposes the creation of a visual SWOT Matrix with these four characteristics. Strengths and weaknesses are internal factors, which provide the business advantage or fragility over the competition. At the same time, opportunities and threats are external factors, which may help to improve business performance or endanger the competitive advantage.

  • Strengths are internal positive characteristics that provide successful outcomes, give a company a competitive advantage, and enable the achievement of its goals. They are used to develop strategies, may include strong customer service, diverse product lines, etc.
  • Weaknesses are internal negative characteristics. These include the company's deficiencies, inefficiencies, internal limitations that may have a negative impact on the company's success or make it more difficult to attain, debt, lack of staff training, or weak brand. The important task is to identify these factors and reasons and eliminate them.
  • Opportunities are external positive factors that provide advantages to the business, increase its success and growth. These include new technologies, social trends, new markets, tax incentives, favorable export tariffs, and other innovations and developments.
  • Threats are external negative factors that could harm a business and threaten its progress. These include controlled and non-controlled risks, restrictions, economic downturns, increasing competition, weakening demand, uncertain supply chain, etc. The timely identification of threats helps to prevent risks, make better decisions, and use resources efficiently.
SWOT Technique

Example 1. SWOT Technique

The systematical recording, tracking, updating, and evaluating of the combination of four SWOT aspects provides a holistic overview of the situation, allows highlighting the most serious issues a company faces, and leads to growth and steady success of a product, service, project, organization, or person. It enables organizations to be informed and evaluate their current situation to make efficient, informed, and timely strategic decisions, which are a way to long-term success.

SWOT analysis is a business management, marketing, and also personal development tool. It is used for individuals to achieve personal goals, for example, plot a career path through identifying their own strengths and weaknesses, threats and opportunities for success.

The application of SWOT analysis before taking any company action is a good practice. Use it to identify areas where your organization is performing optimally and ones, which require adjustments to improve them. Explore new initiatives and analyze their possible impact, identify risks, and make a decision on what to do first - to eliminate the internal weaknesses or reduce the external threats.

SWOT and TOWS Matrix Library Design Elements

Example 2. SWOT and TOWS Matrix Library Design Elements

Use ConceptDraw DIAGRAM with SWOT and TOWS Matrix Diagrams solution to conduct the SWOT analysis and increase awareness of the factors that impact making business decisions or establishing a business strategy. Analyze efficiently the internal and external factors. SWOT and TOWS Matrix Diagrams solution is useful for profit and non-profit organizations, business owners, analysts, marketers, managers, investors, competitors, and other individuals for professional or personal purposes.

ConceptDraw DIAGRAM illustrates the benefits of SWOT technique through included examples and templates. The predesigned vector stencils help to create SWOT matrices without effort. Develop efficient strategies, improve or eliminate your company’s weaknesses, turn them into strengths, and benefit from your strengths. Discuss your SWOT matrix with other team members to make the overall overview and analyze your business from all sides. Benefit from SWOT analysis with ConceptDraw DIAGRAM software.

SWOT Matrix

Example 3. SWOT Matrix

This TOWS Analysis template is included in SWOT and TOWS Matrix Diagrams Solution from the Management Area and is available from ConceptDraw STORE. Use it for effective TOWS analysis and TOWS matrix construction.

All source documents are vector graphic documents. They are available for reviewing, modifying, or converting to a variety of formats (PDF file, MS PowerPoint, MS Visio, and many other graphic formats) from the ConceptDraw STORE. The SWOT and TOWS Matrix Diagrams Solution is available for all ConceptDraw DIAGRAM or later users.

TEN RELATED HOW TO's:
Do you like the professional schemes that you can find on the Internet? Take into account that the most part of them is made using the Best Flowchart Software and Flowchart Symbols. Try you own powers in creating such diagrams! Flowcharts are the most business diagramming tool. If you are a business manager, you can use flow chart to depict work flow in your organization, develop the effective organizational structure and present the information to investors or other stakeholders. Combining the smart management solutions with ConceptDraw DIAGRAM diagramming engine delivers the set of comprehensive flowchart tools necessary to support professionals in their creativeness and business activity.Best Flowchart Software and Flowchart Symbols
Picture: Best Flowchart Software and Flowchart Symbols
Related Solution:
Database structures are usually described by ER-diagrams which represents entities as boxes with lines-connections between them. You can create any entity-relationship diagram (ERD) by means of ConceptDraw DIAGRAM using ready-to-use templates and special libraries containing all the needed symbols and shapes. Creating a model for your database from now on can take just a few minutes. ERD (entity relationship diagram) designed to show the logical structure of databases. It intended to depict the relationships between data components (entities). ERDs are a popular tool for software engineers and architects. Using ERD they can manage the every aspect of database design. Also ERD can be used as guidelines for testing and communications before software release. This diagram represents the file reference system of the WordPress web platform. Because entity relationship diagrams have such a broad application area through the prevalence of database technology, it can be applied for a wide range of users.Entity-Relationship Diagram (ERD) <br>with ConceptDraw DIAGRAM  *
Picture: Entity-Relationship Diagram (ERD) with ConceptDraw DIAGRAM
Related Solution:
UML Collaboration Diagram Example Illustration. This sample was created in ConceptDraw DIAGRAM diagramming and vector drawing software using the UML Collaboration Diagram library of the Rapid UML Solution from the Software Development area of ConceptDraw Solution Park. This sample shows the creation process of the contact list and can be used at the staff training and staff working, at the attraction process the new clients.UML Collaboration Diagram Example Illustration *
Picture: UML Collaboration Diagram Example Illustration
Related Solution:
ConceptDraw DIAGRAM diagramming and vector drawing application is a powerful IDEF0 software thanks to the IDEF0 Diagrams solution from the Software Development area of ConceptDraw Solution Park.IDEF0 Software *
Picture: IDEF0 Software
Related Solution:
If you ever wanted to try any diagramming tools except of Visio, but were afraid to lose existing documents, there’s good news for you. One of the most striking features of ConceptDraw DIAGRAM is it’s perfect compatibility with MS Visio, which guarantees that you won’t depend on operating system anymore, because another ConceptDraw DIAGRAM feature is that it’s cross-platform tool. Don’t waste your time looking for other options, you’ve found the solution already! Business professionals often utilize the MS Visio as a common tool for making various issues on business visualization. MS Visio is a strong software with good capacity to maintain complex business solutions. But there is no MS Visio for Apple OS X. This is a large invocation, and one would be pleased to recognize that ConceptDraw DIAGRAM is the ideal alternative to MS Visio. Primarily, because this software works natively on both Windows and Apple OS X platforms. if you have migrated from Windows to Mac, or need to communicate in a cross-platform conditions, you’ll search for MS Visio replacer. ConceptDraw DIAGRAM is the exclusive professional business diagramming application that runs on both Windows and Apple OS X. The opportunity exchange files between PC and Mac, as well as between ConceptDraw DIAGRAM and Visio is the significant advantage that permits you to display and to collaborate business information in effortless and cost-effective way.ConceptDraw DIAGRAM Compatibility with MS Visio *
Picture: ConceptDraw DIAGRAM Compatibility with MS Visio
Acquaintance with flowcharting starts from getting into basic terms. First of all, flowchart definition is quite clear – a flowchart is a graphical representation of a process or an algorithm made of special symbols. Secondly, flowcharting is an irreplaceable tool for IT specialists, project managers, and anyone who wants a clear understanding of any imaginable process.Flowchart Definition
Picture: Flowchart Definition: A Complete Guide
Related Solution:
ConceptDraw DIAGRAM extended with IDEF0 Diagrams solution from the Software Development area of ConceptDraw Solution Park is a powerful diagramming and vector drawing IDEF0 software. All IDEF0 diagrams created in ConceptDraw DIAGRAM are vector graphic documents and can be reviewed, modified and converted to MS Visio XML format. To obtain the IDEF0 Visio documents from ConceptDraw DIAGRAM documents use the wide export possibilities of ConceptDraw DIAGRAM.IDEF0 Visio *
Picture: IDEF0 Visio
Related Solution:
Also included are standardized hr flowchart symbols, meaning your diagrams will be relevant and understood by all business associates.HR Flowchart Symbols
Picture: HR Flowchart Symbols
Related Solution:
Sales process management is a business discipline which focuses on the development and practical application of various sales techniques, and on the management of sales operations of the company.

It is effective to use professional software for the sales process management. ConceptDraw DIAGRAM diagramming and vector drawing software extended with Sales Flowcharts solution from the Marketing area of ConceptDraw Solution Park is the best choice.Sales Process Management *

Picture: Sales Process Management
Related Solution:
ConceptDraw DIAGRAM is a flowchart design software. There are large collections of professional flowchart symbols for process flow diagrams, standard flowchart symbols and colored basic flowchart symbols. Built-in examples and video lessons allow users to get started immediately and do drawing of virtually any type of flowchart or process flow diagramsFlow Chart Creator *
Picture: Flow Chart Creator
Related Solution:
ConceptDraw
DIAGRAM 18