Made with
ConceptDraw
DIAGRAM 18

Software development with ConceptDraw DIAGRAM

ConceptDraw is a tool for technical and business graphics. It provides specialists who create graphic documentation with a possibility to focus not on the process of drawing itself but on the essence of the task. For this ConceptDraw features a huge number of ready-to-use objects (4590 for the moment of writing the article), smart connectors, layers, hyperlinks and many other possibilities.

Use it for::

  • visual object-oriented design
  • flowcharts
  • design of GUI
  • management of development projects
  • automation of projecting and development
  • visualization of data
  • DB design and visualization of DB data

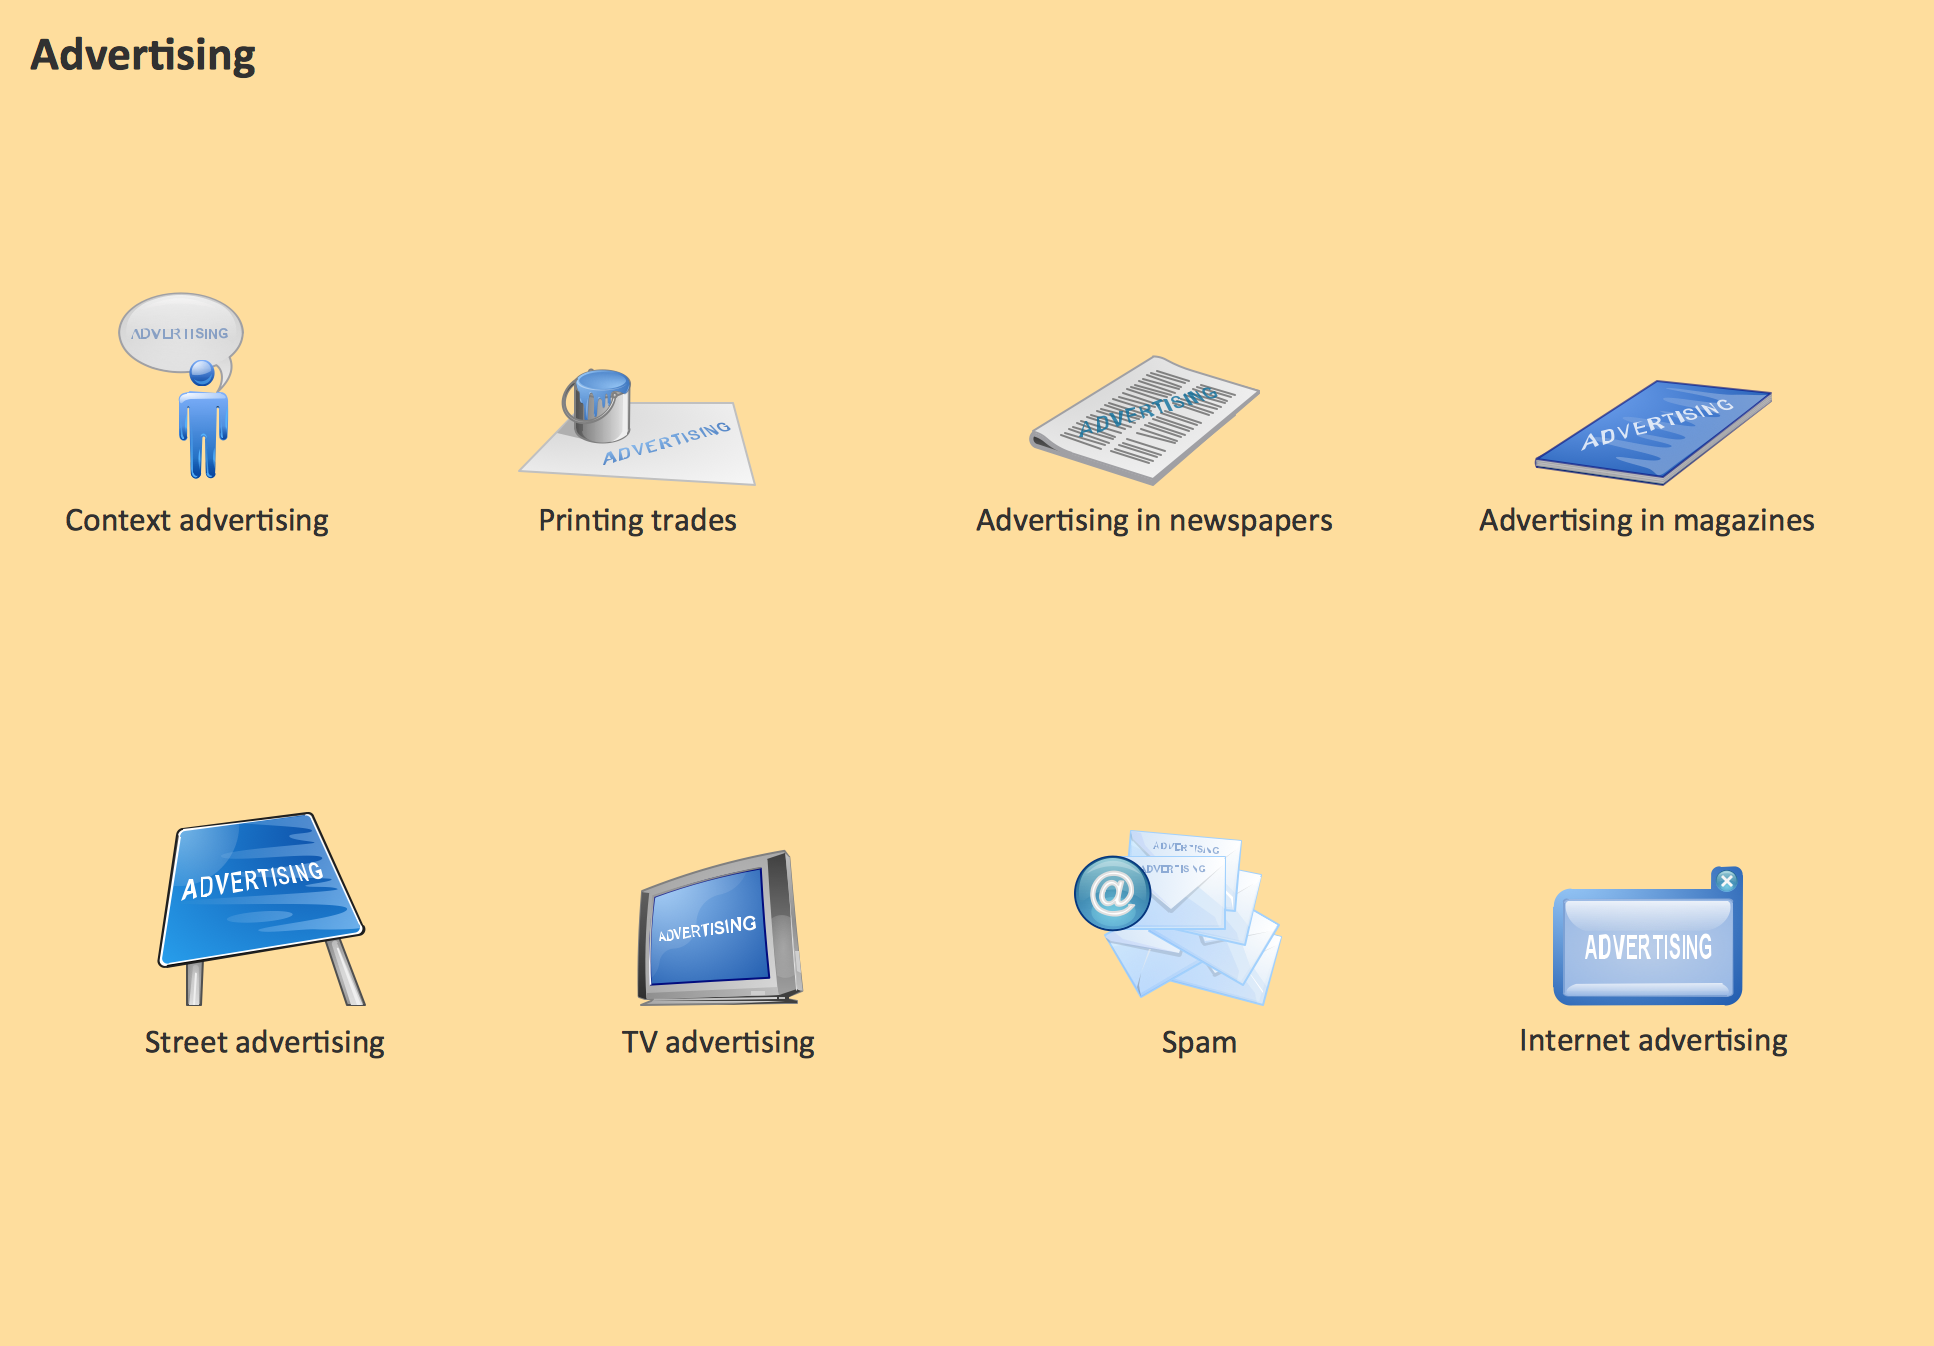
Modern development of program software leads to a large amount of graphic documentation: diagrams describing the work of applications in various cuts and notations, GUI design, documentation on project management. Each of these fields is represented by topical libraries and templates.

To ConceptDraw DIAGRAM new possibilities have been added, thanks to which the program became a sequence higher useful for developers. The most considerable innovations are:

  • a set of wizards for automation of widespread tasks
  • built-in scripting language, which helps to automate tasks specific for your particular situation.

Let us consider typical applications.

Benefits:

  • topical templates and libraries with ready-to-use shapes
  • topical wizards
  • powerful graphic possibilities (2D-graphics)
  • smart connectors
  • support of hyperlinks
  • numerous export formats
  • scripting language ConceptDraw Basic
  • possibility of using external shared libraries
  • 4 open text formats
  • XML support
  • support of ODBC-compatible databases
  • multilateral parameterization of objects
  • cross-platform compatibility (Mac, PC)

Object-oriented design

UML Class Diagram

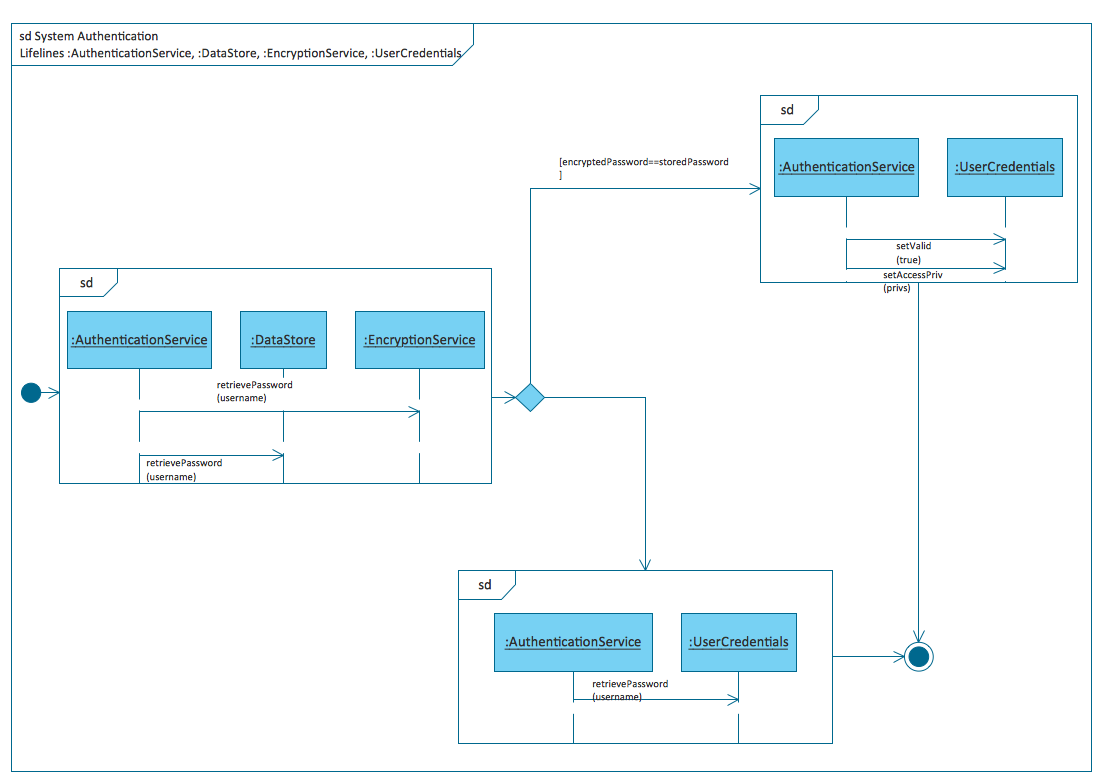
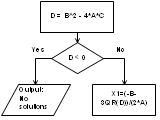
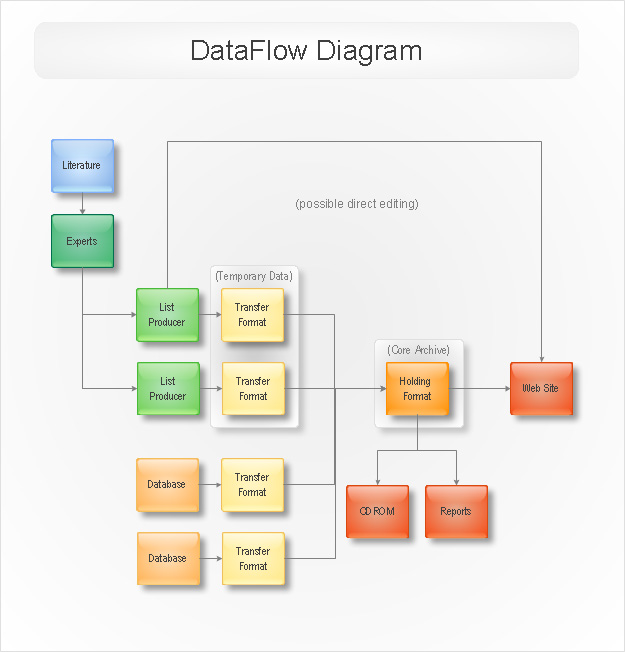
Over the recent years object-oriented methodology has become more and more widespread. Thanks to this methodology developers manage to deal with growing complexity of applications. More and more programs are written in such programming languages as C++, Java, Visual Basic and Object Pascal. However, the complexity of the designed systems imposes extended requirements as to design of graphic documentation. ConceptDraw possesses powerful tools for designing of technical documentation for object-oriented projects. The libraries included in the package allow to easily draw class hierarchies, object hierarchies and diagrams of data flows with the use of the most popular notations, including UML and Booch notations. And the library for projecting COM-interfaces will spare developers of ActiveX-servers a headache.

Flowcharts of algorithms and business-processes

algorithm a graphic form Flowcharting is a conventional way of recording algorithms in a graphic form. ConceptDraw is an ideal means for their creation. Easiness of flowcharting in ConceptDraw is really impressive. This functionality is useful for students and teachers of informatics.
Data Flow Diagram
Data Flow Diagram
At development of real application flowcharts are widely used for clearing processes on which business-logics of the application will be based.

Prototyping Graphical User Interface (GUI)

GUI design ConceptDraw allows to more tightly draw art designers, managers and users to the process of GUI design. Now libraries of controls for Windows 95, Windows XP, MacOS and MacOS X are available to all of them and they can share their vision of Windows, menu and web-forms on various platforms with developers.

Project management

Project management

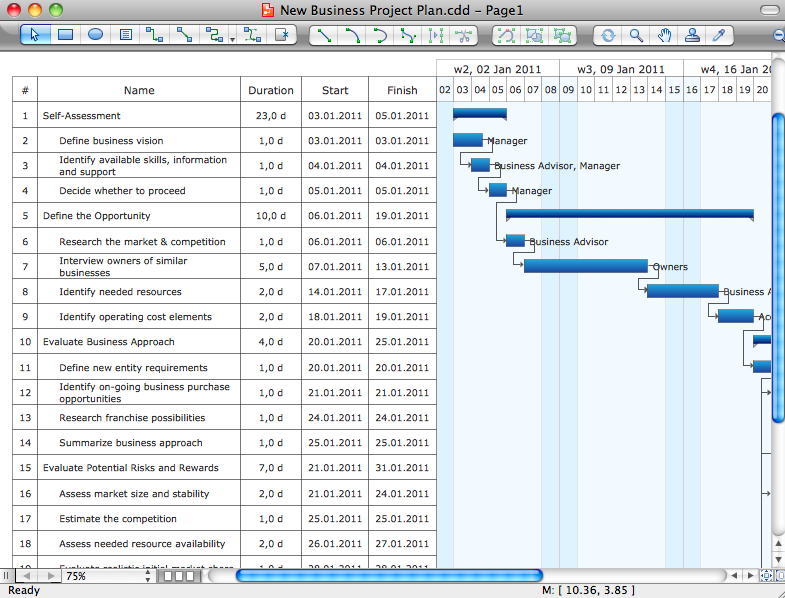
For a large-scale project to be completed successfully it should be thoroughly projected. One of the generally recognized and visual tools for projecting and tracking timeliness of the work on a project is a Gantt chart. ConceptDraw offers the wizard for automatic creation of Gantt chart.

The other side of the question of project management is the dynamism of changes. Changes in a project and its documentation are made daily. All updates should be done in time and be available to each developer. ConceptDraw offers many methods of solving this question:

  • Cross platform compatibility. ConceptDraw is released in two versions: for PC and for Mac. Its files can be easily read by the both versions. It means you can exchange documents with your colleagues and partners working on different platforms.
  • Export to HTML provides the possibility of getting a set of ready web-pages based on a ConceptDraw file, which can be displayed in intranet or Internet for all who care.
  • Export to PDF and graphic formats are designed, first of all, for sending information via e-mail.

Automation of management and development process

ConceptDraw DIAGRAM supports XML. XML for ConceptDraw has been created and, at the same time, support for import XML for Visio. All this allows to develop solutions for automation of various aspects of software development.

For instance:

  • generation of UML diagrams etc. on the ready initial code
  • generation of the initial code
  • generation of resources for Windows and MacOS, web-forms
  • and a lot more

Visualization of data

ConceptDraw is a good means for visualization of information of any kind. The program features powerful graphic possibilities. Thus, on the ready graphic kernel ConceptDraw the rest products of the line have been developed: ConceptDraw PROJECT , ConceptDraw MINDMAP . This powerful graphic kernel (2D-graphics) is supported by a number of open formats (including XML). To this add the flexibility of data processing, connected with the scripting language ConceptDraw Basic (included in version V), and also the flexibility in parameterization of objects, which is provided by the whole table of the object parameters (which is available for editing even from the program's interface). So in the end it becomes clear that visualizing of information in ConceptDraw is a good idea.

So, the typical task for ConceptDraw Basic is to automate the visualization of some data. This data can be obtained as the result of work of an arbitrary application (including ConceptDraw-script) and saved in a text file, ODBC-compatible database or in one of the open formats supported by ConceptDraw. In the first two cases, data will further be read and visualized with the help of ConceptDraw Basic. In case of using a ConceptDraw open format (XML for ConceptDraw or XML for Visio) the obtained document can be simply opened in ConceptDraw, you can then add some details of design and get a presentable diagram. Possibilities of ConceptDraw Basic considerably increase at using in script the functions exported by the shared libraries.

The conclusion is: ConceptDraw is a platform worth considering for writing solutions, connected with data visualization.

Work with databases

Software development with ConceptDraw DIAGRAM  *

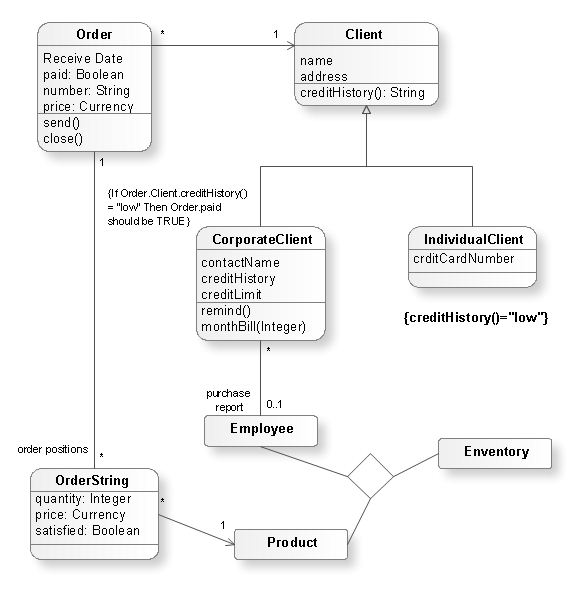
Special attention has been given to work with databases. There are libraries for designing databases in various notations: ORM, Chen ERD and Martin ERD, Express-G and relational diagrams. Starting from version V, ConceptDraw supports ODBC-compatible databases. Interaction with them is possible with the help of the scripting language ConceptDraw Basic. Besides, in ConceptDraw Professional package there is Database Model Diagram wizard (it can be found among the templates of the section ERD & Database). It builds a model of an arbitrary presented by the user in the form of DSN database.

Having applied all said above about possibilities of ConceptDraw in fields of projection, automation and visualization of data, we can conclude, that the program is well designed for solving the following tasks:

  • design of databases
    • ORM-diagrams
    • ER-diagrams
    • relational diagrams
  • reengineering of databases
  • visual displaying of data in the form of charts and diagrams

Additional materials

For more details on various applications of ConceptDraw for solution developers read the articles:


TEN RELATED HOW TO's:
The UML diagram is a powerful tool which lets visually represent all system's components, the interactions between them and relationships with external user interface. The Rapid UML solution for ConceptDraw DIAGRAM software offers diversity of UML flowchart symbols for drawing all types of UML diagrams.UML Flowchart Symbols *
Picture: UML Flowchart Symbols
Related Solution:
The vector stencils library Crow's Foot Notation from the solution Entity-Relationship Diagrams (ERD) contains specific symbols of the Crow's foot notation such as relationship symbols and entity symbols for ConceptDraw DIAGRAM software.Martin ERD Diagram
Picture: Martin ERD Diagrams
Related Solution:
Program Structure Diagram is a visual representation of a program's organization, showing its components and their relationships.Program Structure Diagram
Picture: Program Structure Diagram
A flowchart is a powerful tool for examining processes. It helps improving processes a lot, as it becomes much easier to communicate between involved people, to identify potential problems and to optimize workflow. There are flowcharts of different shapes, sizes and types of flowchart vary from quite basic process flowcharts to complex program flowcharts. Nevertheless, all these diagrams use the same set of special symbols like arrows to connect blocks, parallelogram to show data receiving or rectangles for showing process steps. Basic flowcharts are used to represent a simple process algorithm. A basic flowchart notation consists of rectangles (business processes), arrows (the flow of information, documents, etc.). The same notation is used in items such as the "decision", which allow you to do the branching. To indicate the start of the entire business process and its termination can be used the "Terminator" element. The advantages of Basic Flowchart are simplicity and clarity. With it you can quickly describe the business process steps. Creating of Basic Flowchart does not require any special knowledge, as easily understand by employees with different levels of education and IQ.Types of Flowchart — Overview
Picture: Types of Flowchart: Comprehensive Overview
Related Solution:
ConceptDraw is a good means of visualization of information of any kind as it features powerful graphic capabilities. The conception of using ConceptDraw and open formats by the programs that work with Internet can be used for displaying any data and any structure in Internet.Internet solutions with ConceptDraw DIAGRAM *
Picture: Internet solutions with ConceptDraw DIAGRAM
Use ConceptDraw DIAGRAM enhanced with solutions from ConceptDraw Solution Park to create diagrams to present and explain structures, process flows, logical relationships and networks.Cross-Functional Flowcharts <br>in ConceptDraw *
Picture: Cross-Functional Flowcharts in ConceptDraw
A database is a data collection, structured into some conceptual model. Two most common approaches of developing data models are UML diagrams and ER-model diagrams. There are several notations of entity-relationship diagram symbols and their meaning is slightly different. Crow’s Foot notation is quite descriptive and easy to understand, meanwhile, the Chen notation is great for conceptual modeling. An entity relationship diagrams look very simple to a flowcharts. The main difference is the symbols provided by specific ERD notations. There are several models applied in entity-relationship diagrams: conceptual, logical and physical. Creating an entity relationship diagram requires using a specific notation. There are five main components of common ERD notations: Entities, Actions, Attributes, Cardinality and Connections. The two of notations most widely used for creating ERD are Chen notation and Crow foot notation. By the way, the Crow foot notation originates from the Chen notation - it is an adapted version of the Chen notation.ERD Symbols and Meanings
Picture: ERD Symbols and Meanings
Related Solution:
The Workflow diagrams are the specialized type of flowcharts which allow to visualize any sorts of step-by-step processes. They are usually created as flowcharts, with objects that represent in a simple visual manner the steps in the process connected by arrows that indicate the next step. The ability easily create Workflow diagrams visually describing the tasks, documents associated with the tasks, people which are responsible for execution at each stage of workflow is made possible with Workflow Diagrams solution. This solution extends ConceptDraw DIAGRAM with a Workflow Diagram library that contains large collection of predesigned workflow flowchart symbols.Workflow Flowchart Symbols *
Picture: Workflow Flowchart Symbols
Related Solution:
Use ConceptDraw DIAGRAM with Accounting Flowcharts solution to document and communicate visually how accounting processes work, and how each operation is done.Accounting Flowchart: Purchasing, Receiving, Payable and Payment
Picture: Accounting Flowchart: Purchasing, Receiving, Payable and Payment
Related Solution:
Data base diagrams describes inter-related data and tables. It describes roles and relationships, internal and external dependencies, data exchange conventions and structures of knowledge domain. ConceptDraw Software provides number of data-base chart libraries including major 49 vector symbols. Use these DFD flowchart symbol libraries to design data-base structure and models, use it to design data base process-oriented models, or simple data-oriented models. The are special drawing tools for making data flowcharts, data process diagrams, structured analysis diagrams, and information flow diagrams.Database Flowchart Symbols *
Picture: Database Flowchart Symbols
Related Solution:
ConceptDraw
DIAGRAM 18