Customer Relationship Management
Customer relationship management is an important component of sales success. Visualizing sales data you may put some KPI related to customers relationship management to your Sales dashboard and track this important aspect in real time.HelpDesk
How to Track Your Project Plan vs. the Actual Project Condition
Conceptdraw PROJECT allows to follow how the project is going. You can easily compare the actual project data with the planned ones. The best tool for effective tracking of the project execution is to compoare real data with project baseline. It consists from the baseline start, baseline finish and baseline cost. Along with Baseline tracking ConceptDraw PROJECT offers several types of visual reports that can help to assess visually the difference between planned and actual project data.HelpDesk
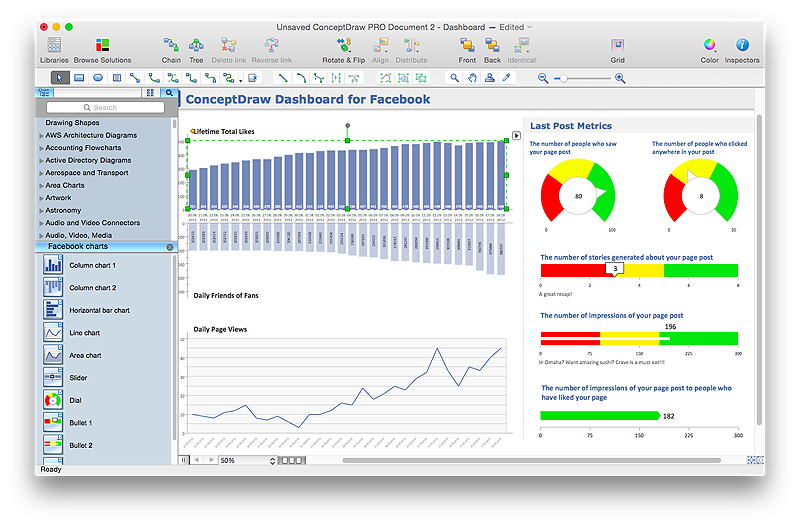
How to Use ConceptDraw Dashboard for Facebook on OS X
The ConceptDraw Dashboard for Facebook Solution is a visual dashboard that visualizes lifetime total Likes, daily Friends of Fans, and daily Page views based on the information exported from your Facebook Page.HelpDesk
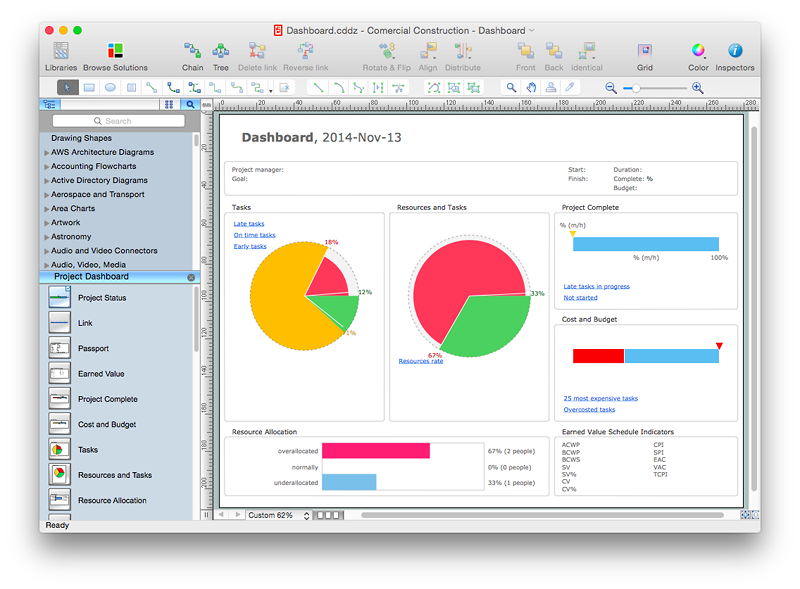
How to Create Project Dashboard on Mac
The visual Project Dashboard within ConceptDraw Office is the best way to deliver a clear view of project performance to all project participants.Dashboard
ConceptDraw PRO extended with Sales Dashboard solution from the Marketing area of ConceptDraw Solution Park is a perfect software for creating the live dashboard for the business data and progress visualization.A KPI Dashboard Provides the Answers Your Sales Team
Sales dashboard is a tool that provides the answers to all questions your sales team may have. A mature sales dashboard provides complete set of KPI to shows corporate, team or personal performance to keep sales process clear.Data Visualization Software Solutions
To see how your business can improve you can try data visualization software solutions that allows you visualize all your sales KPI in one sales dashboard allows you monitor and analyse sales activities.
 Meter Dashboard
Meter dashboard solution extends ConceptDraw PRO software with templates, samples and vector stencils library with meter indicators for drawing visual dashboards showing quantitative data.
HelpDesk
How to Create a Sales Dashboard Using ConceptDraw PRO
Visual dashboard is a valuable tool for any sales team. Sales dashboard allows you to view and monitor sales indicators that are important for manager and sales staff . It helps to use the timely and reliable information to improve the quality of sales performance and increase sales revenues. ConceptDraw Sales Dashboard solution is a tool for both: sales manager and sales team. It provides the visualization of key performance indicators that are critical to the entire sales organization. The custom sales dashboard displays the real-time information on sales performance KPIs with the help of intuitive and easy-to-understand diagrams and charts.
 Spatial Dashboard
Spatial dashboard solution extends ConceptDraw PRO software with templates, samples and vector stencils libraries with thematic maps for drawing visual dashboards showing spatial data.
The Facts and KPIs
Visualizing sales data help you see the facts and KPIs about your sales process to make conclusions and see how your business can improve.
 Status Dashboard
Status dashboard solution extends ConceptDraw PRO software with templates, samples and vector stencils libraries with graphic indicators for drawing the visual dashboards showing status data.
 Frequency Distribution Dashboard
Frequency distribution dashboard solution extends ConceptDraw PRO software with samples, templates and vector stencils libraries with histograms and area charts for drawing the visual dashboards showing frequency distribution of data.
 Composition Dashboard
Composition dashboard solution extends ConceptDraw PRO software with templates, samples and vector stencils library with charts and indicators for drawing visual dashboards showing data composition.
 Correlation Dashboard
Correlation dashboard solution extends ConceptDraw PRO software with samples, templates and vector stencils library with Scatter Plot Charts for drawing the visual dashboard visualizing data correlation.
- Dashboard Project Management Kpi
- Visual Management Board Template
- Project Management Dashboards Examples
- Visual Management Boards Examples
- PM Dashboards | Project management task status dashboard | How ...
- Quality Visual Dashboard
- Employee distribution - HR dashboard | Projects HR dashboard ...
- Visual Management Speedometer
- Construction Project Management Dashboard Template
- Status Dashboard | Construction Project Chart Examples | How to ...
- Project task status dashboard - Template | Sales Dashboard ...
- PM Dashboards | Status Dashboard | Frequency Distribution ...
- Customer Relationship Management | Dashboard | Logistic ...
- Website metrics - Visual dashboard
- Status Dashboard | TQM Diagram — Professional Total Quality ...
- Cafe performance metrics vs. air temperature - Visual dashboard ...
- Design elements - Meter indicators | Sales metrics and KPIs - Visual ...
- Website traffic dashboard | Website KPIs - Visual dashboard ...
- Status Dashboard | Project task status dashboard - Template | PM ...
- Project task status dashboard - Template | Project management task ...
- ERD | Entity Relationship Diagrams, ERD Software for Mac and Win
- Flowchart | Basic Flowchart Symbols and Meaning
- Flowchart | Flowchart Design - Symbols, Shapes, Stencils and Icons
- Flowchart | Flow Chart Symbols
- Electrical | Electrical Drawing - Wiring and Circuits Schematics
- Flowchart | Common Flowchart Symbols
- Flowchart | Common Flowchart Symbols


