 Entity-Relationship Diagram (ERD)
Entity-Relationship Diagram (ERD) solution extends ConceptDraw DIAGRAM software with templates, samples and libraries of vector stencils from drawing the ER-diagrams by Chen's and crow’s foot notations.
Entity-Relationship Diagram

ER diagram tool for OS X
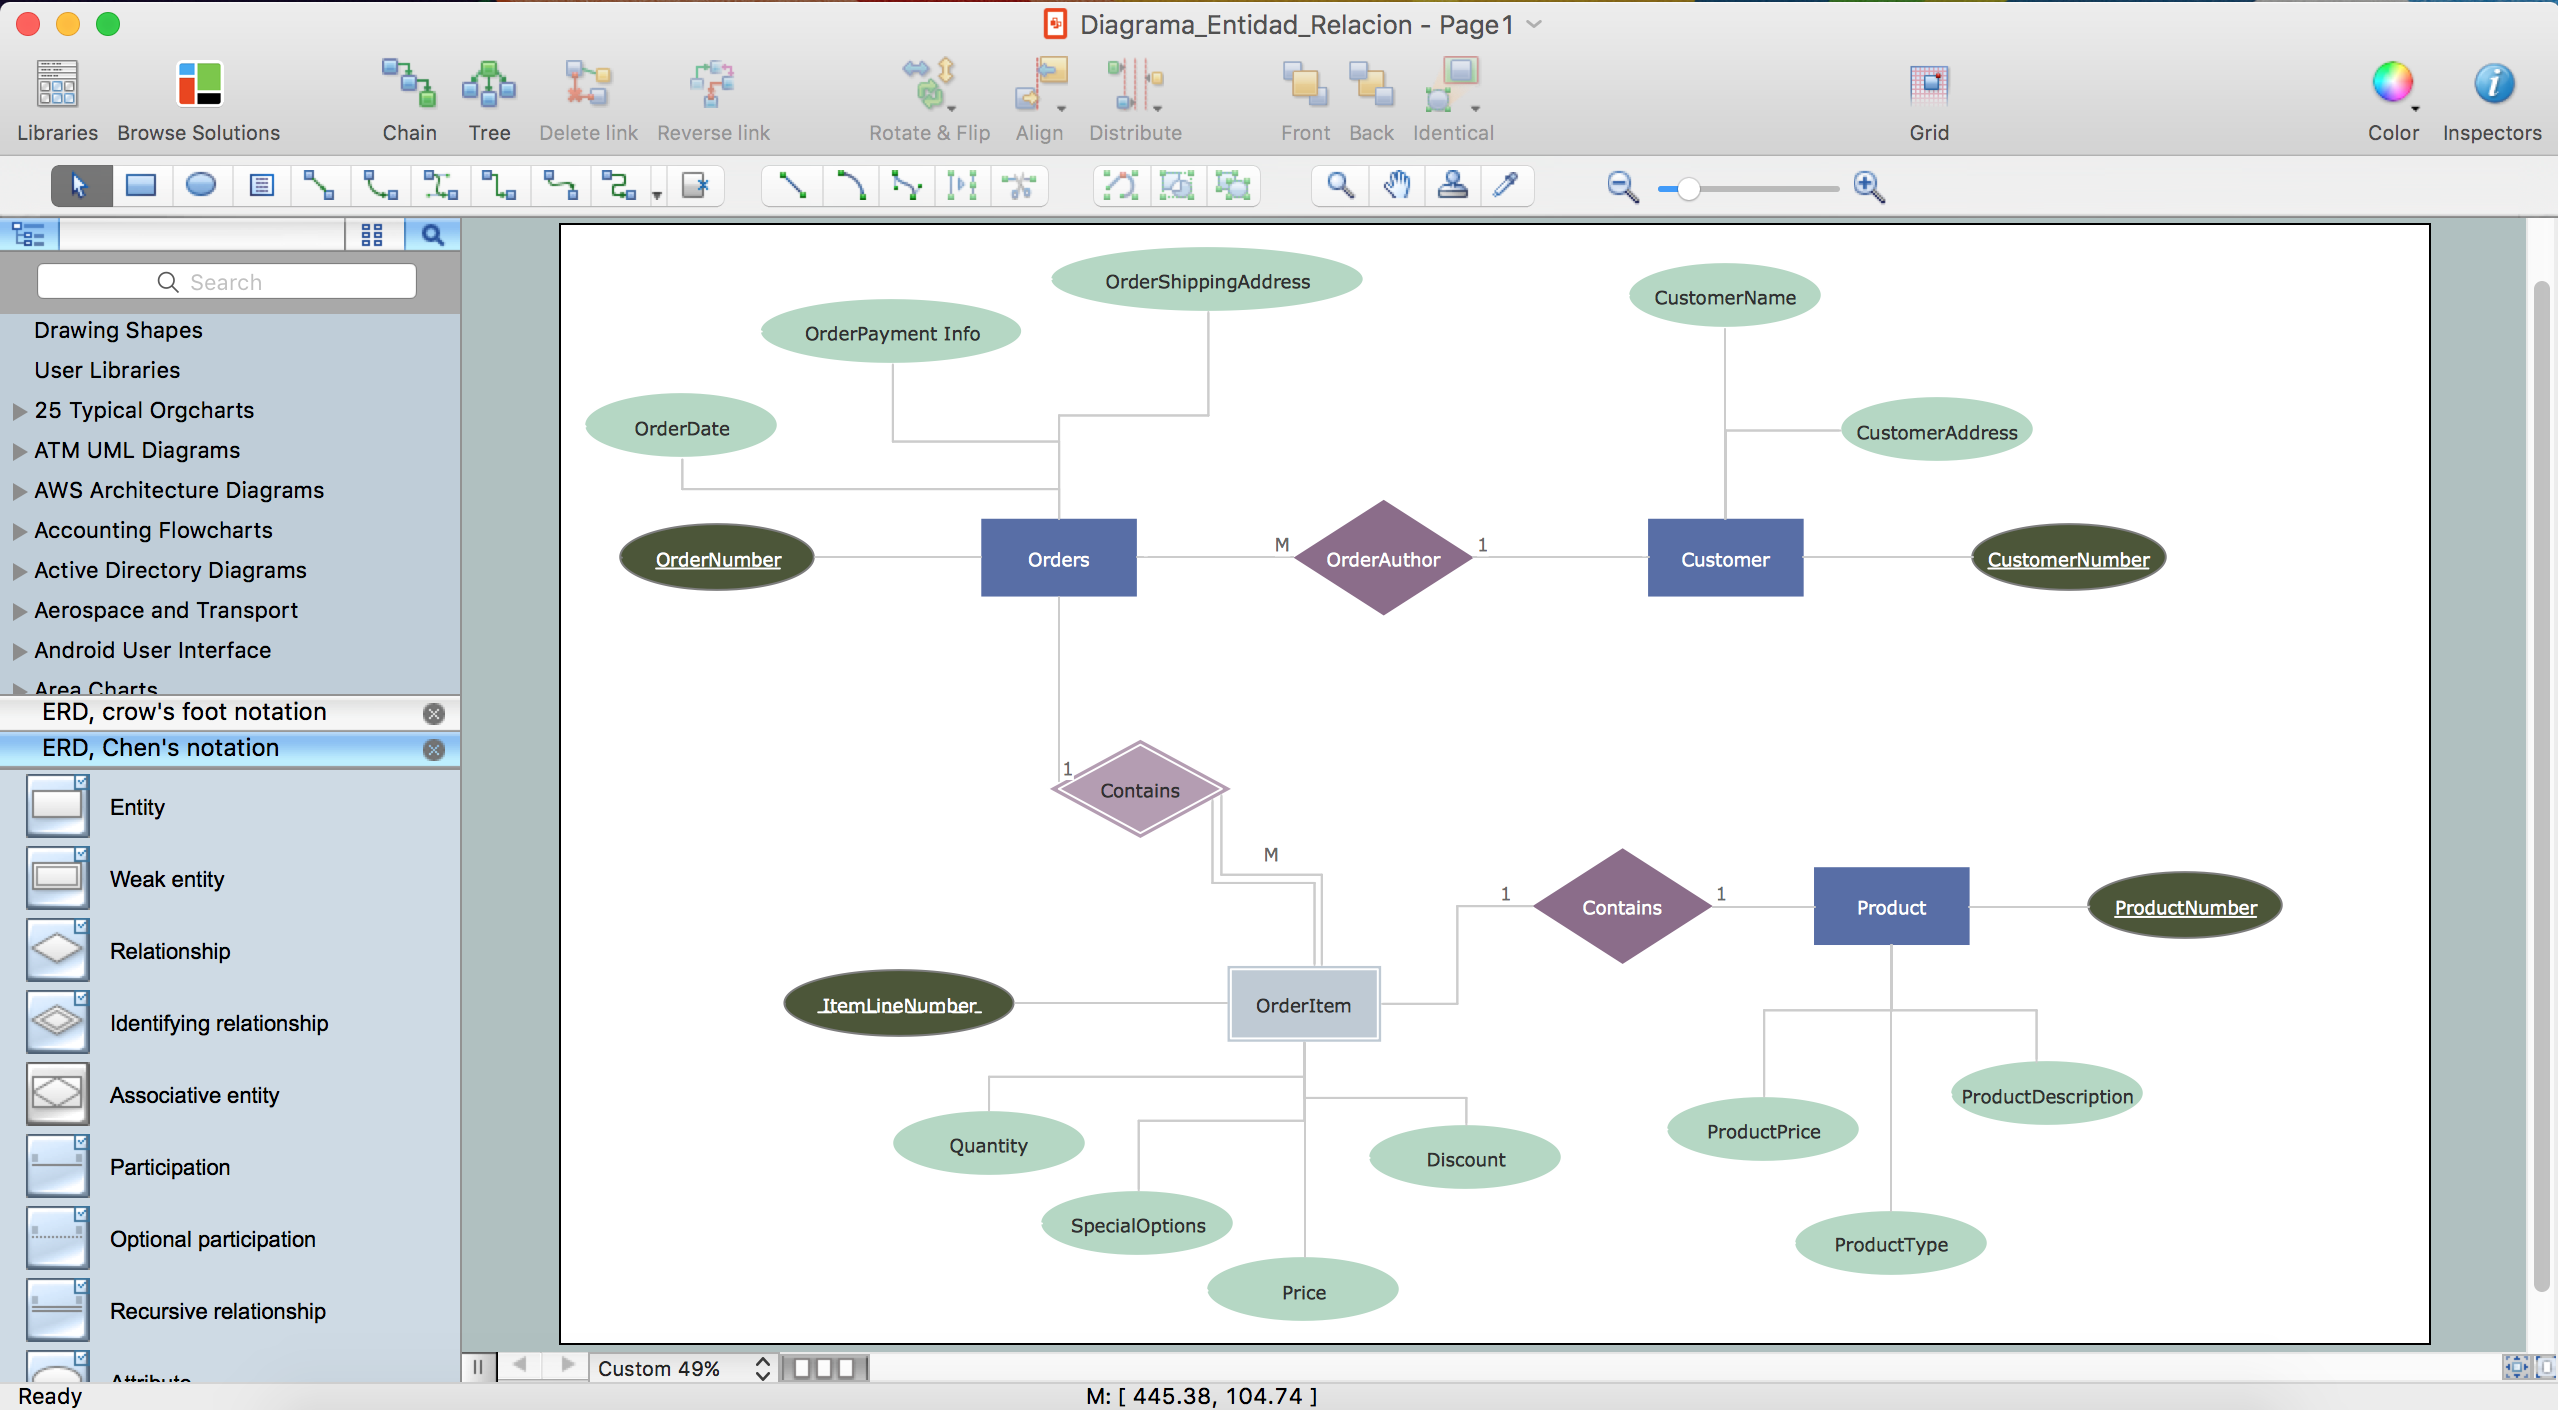
Drawing ER diagrams on a Mac

E-R Diagrams

 Fishbone Diagram
Fishbone Diagrams solution extends ConceptDraw DIAGRAM software with templates, samples and library of vector stencils for drawing the Ishikawa diagrams for cause and effect analysis.
 Education
This solution extends ConceptDraw DIAGRAM and ConceptDraw MINDMAP with specific content that helps illustrate educational documents, presentations, and websites quickly and easily with astronomy, chemistry, math and physics vector pictures and clip art.
 Cross-Functional Flowcharts
Cross-functional flowcharts are powerful and useful tool for visualizing and analyzing complex business processes which requires involvement of multiple people, teams or even departments. They let clearly represent a sequence of the process steps, the order of operations, relationships between processes and responsible functional units (such as departments or positions).
 eLearning for Skype
This solution extends ConceptDraw MINDMAP software with the ability to prepare and run remote learning sessions by using Skype
 School and Training Plans
School and Training Plans solution enhances ConceptDraw DIAGRAM functionality with extensive drawing tools, numerous samples and examples, templates and libraries of classroom design elements for quick and professional drawing the School and Training plans, School Floor plans, Classroom Layout, Classroom Seating chart, Lecture Room plans of any complexity. Each offered classroom seating chart template is a real help for builders, designers, engineers, constructors, as well as teaching personnel and other teaching-related people in drawing Classroom Seating charts and Training Room layouts with ConceptDraw DIAGRAM classroom seating chart maker.
 Illustration
This solution extends ConceptDraw DIAGRAM.4, allowing you to make professional-looking documents, presentations and websites illustrated with color, scalable vector clip art and shapes, regardless of drawing skills.
 Collaboration Area
The solutions from Collaboration area of ConceptDraw Solution Park extend ConceptDraw DIAGRAM and ConceptDraw MINDMAP software with features, samples, templates and vector stencils libraries for drawing diagrams and mindmaps useful for collaboration.
- Education | Entity - Relationship Diagram (ERD) | Development of ...
- ER diagram tool for OS X | Drawing ER diagrams or on a Mac | Entity ...
- ER diagram tool for OS X | ER Diagram Programs for Mac | Entity ...
- Entity - Relationship Diagram (ERD) | Drawing ER diagrams or on a ...
- Entity Relationship Diagram Software for Mac | ER Diagram ...
- ER diagram tool for OS X | Entity - Relationship Diagram (ERD ...
- Entity - Relationship Diagram | Drawing ER diagrams or on a Mac ...
- ER diagram tool for OS X | ER Diagram Programs for Mac ...
- ER diagram tool for OS X | Entity Relationship Diagram Software for ...
- Drawing ER diagrams or on a Mac | Entity - Relationship Diagram ...
- Entity Relationship Diagram Software for Design Crows Foot ER ...
- Entity - Relationship Diagram (ERD) | ER Diagrams with ...
- ER diagram tool for OS X | ERD Symbols and Meanings | Entity ...
- Entity - Relationship Diagram
- ER Diagrams with ConceptDraw PRO | Entity - Relationship Diagram ...
- ER diagram tool for OS X
- Entity - Relationship Diagram (ERD) | ConceptDraw PRO Database ...
- Entity Relationship Diagram Software for Design Crows Foot ER ...
- Entity Relationship Diagram Software Engineering | Entity ...
- ER Diagrams with ConceptDraw PRO | Entity Relationship Diagram ...
- ERD | Entity Relationship Diagrams, ERD Software for Mac and Win
- Flowchart | Basic Flowchart Symbols and Meaning
- Flowchart | Flowchart Design - Symbols, Shapes, Stencils and Icons
- Flowchart | Flow Chart Symbols
- Electrical | Electrical Drawing - Wiring and Circuits Schematics
- Flowchart | Common Flowchart Symbols
- Flowchart | Common Flowchart Symbols