This site uses cookies. By continuing to browse the ConceptDraw site you are agreeing to our Use of Site Cookies.
HelpDesk

How To Create MS Visio Cross-Functional Flowchart

Cross-functional is a process involving several functional layers. Such processes typically cause the most problems, and therefore, is the most potential for improvement. Cross-functional business processes usually illustrate the processes of product development, commercial proposal development, the order execution process - everything, that involves several departments. The package of possible improvements - is the task of re-engineering. To illustrate the cross-functional processes often use cross-functional flowchart is often used to illustrate the cross-functional processes. ConceptDraw DIAGRAM allows you to easily create a cross-functional flowchart. Then, you can export it to MS Visio VSDX or VDX format and successfully share it with your colleagues still using MS Visio.
HelpDesk

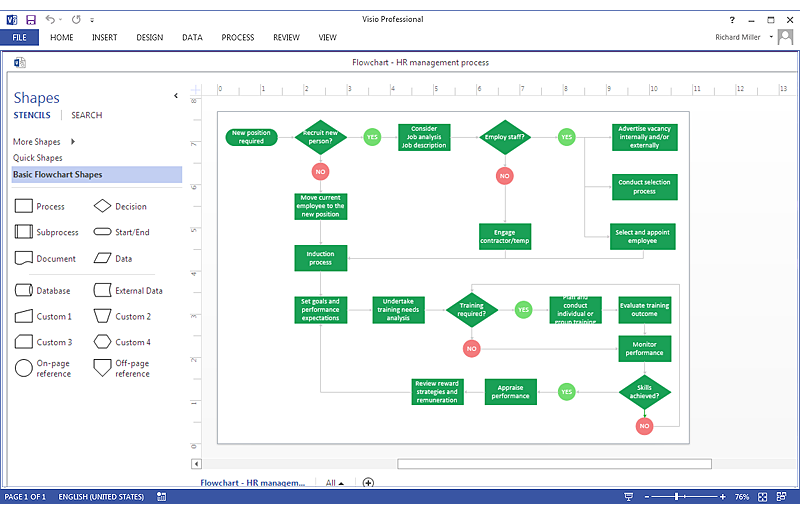
How To Create MS Visio Flowchart

A flowchart is a diagram that successively depicts all process steps. The basic flowchart is the easiest and understandable type of flowchart. Making a processor workflow step-by-step visualization helps you to better understand it and effectively communicate with your audience. Flowcharting is the best way to do this. Using ConceptDraw DIAGRAM you can design flowcharts of any complexity on Windows or macOS. Then you can export them to Visio format to share with the users of MS Visio. Moreover, using ConceptDraw DIAGRAM you can open and edit a flowchart made in Visio, regardless of whether you are using macOS or Windows.
HelpDesk

How to Create a Data Flow Diagram

Data flow diagramming is a highly effective technique for showing the flow of information through a system. Data flow diagrams reveal relationships among and between the various components in a program or system. DFD is an important technique for modeling a system’s high-level detail by showing how input data is transformed to output results through a sequence of functional transformations. The set of standard symbols is used to depict how these components interact in a system. ConceptDraw DIAGRAM allows you to draw a simple and clear Data Flow Diagram using special libraries.
HelpDesk

How To Create a MS Visio Business Process Diagram

Business process diagrams are specialized types of flowcharts based on the Business Process Model and Notation. The BPMN specification describes the symbols to display business processes in the form of business process diagrams. The main objective of BPMN is to create a standard set of symbols that are understandable to all business users, such as business analysts who create and improve processes, technical developers responsible for implementing processes and managers who take care processes and control them. Making a business process diagram involves many different elements that can be managed using ConceptDraw DIAGRAM. The ability to design Business process diagrams is delivered by the Business Process Diagrams solution. ConceptDraw DIAGRAM supports export of business process diagrams to MS Visio files. Thus, you can share your business documentation with MS Visio users.

ConceptDraw DIAGRAM Compatibility with MS Visio

For those who are migrating from MS Visio to ConceptDraw DIAGRAM, or for those who have colleagues and clients who use Visio, ConceptDraw DIAGRAM is compatible with MS Visio.VSDX formatted files.VSDX is Visio’s open XML file format, and it can be easily imported and exported by ConceptDraw DIAGRAM.
HelpDesk

How To Make Visio Circle-Spoke Diagram

Circle-Spoke Diagram consists of a central round balloon, which is circled with other balloons as a ring. The Circle-Spoke Diagram is usually used in marketing. It shows the relationships between entities and the central element. Circle-Spoke Diagram can be used in marketing documentation and presentations. ConceptDraw DIAGRAM allows you to easily create marketing charts of any complexity, including the circle-spoke diagram and then make an MS Visio file from your diagram in a few simple steps. You can easily design your business documentation and share it easily with MS Visio users.
HelpDesk

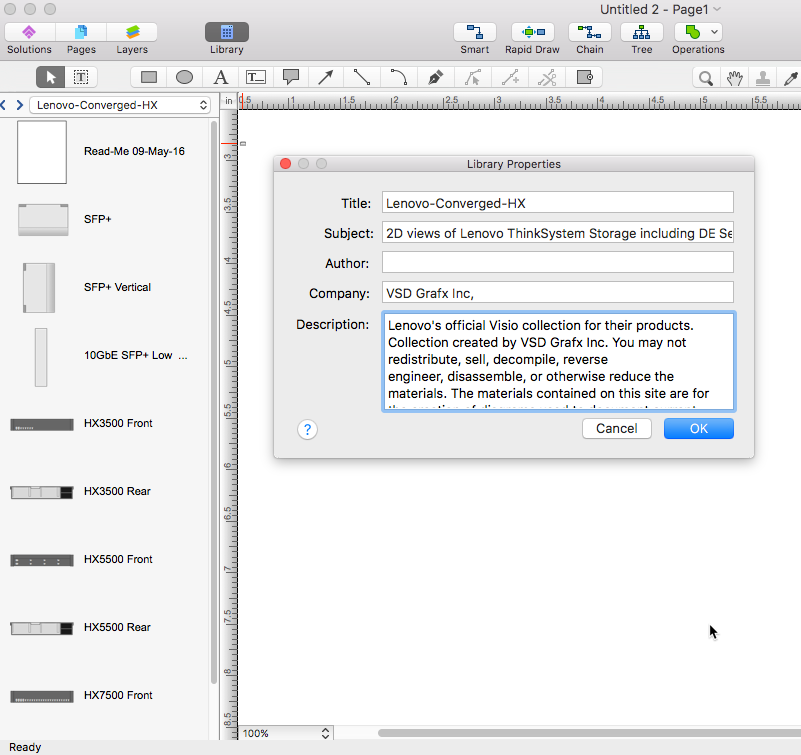
How to Convert MS Visio Custom Stencil to ConceptDraw DIAGRAM

Microsoft Visio allows users to create a new custom stencil to store objects that one wants to reuse later or share it with other people. ConceptDraw DIAGRAM supports the possibility to open Visio custom stencils and shapes. With the introduction of Visio 2013, Microsoft has changed the native file format used in earlier versions of Microsoft Visio. Thus, when you are looking for a professional tool to open and save in the newer Visio 2013 file format on Mac. ConceptDraw DIAGRAM is exact solution for you.
HelpDesk

How To Create Cause and Effect (Fishbone) Diagram in MS Visio

Cause-and-Effect Ishikawa Diagram is a graphical method of analysis and cause-effect relationships, a tool in the form of fish bone. It is used to systematically determine the cause of the problem and represent it graphically. The technique is primarily used in the framework of quality management for the analysis of quality problems and their causes. Nowadays, it has found worldwide distribution and is used in multiple problem areas. It is one of the tools of lean manufacturing, which is used in group work to find the problems and their causes. ConceptDraw DIAGRAM allows you to easily create Fishbone (Ishikawa) diagram and then make an MS Visio VSDX, or VSD files from your diagrams in a couple clicks, using the export capabilities of ConceptDraw DIAGRAM.
HelpDesk

How To Create a Workflow Diagram in Visio

A workflow diagram shows a working process as a set of related events that follow each other in a particular order. They are usually created as flowcharts, with shapes that represent steps in the process connected by arrows that indicate the next step. Making a business process diagram involves many elements that can be managed using ConceptDraw DIAGRAM. The ability to design workflow diagrams is delivered by the Workflow Diagrams solution. ConceptDraw DIAGRAM allows you to easily create workflow diagrams and then make an MS Visio file from your diagrams. Using ConceptDraw DIAGRAM, you can export your workflow diagrams to MS Visio VSDX and VDX files.
HelpDesk

How to Draw a Circular Arrows Diagram

The cyclic recurrence is a fundamental property of multiple systems. The cycle is a process which consists of elements (phases, stages, stages) following each other. Many processes in astronomy, biology, chemistry, physics, mathematics, etc. have a cycle properties. It is also widely used in information technologies and marketing analysis. Graphical representation of cyclic processes can have many forms. It can be a circle, parabola, hyperbola, ellipse, and others. A Circular Arrows Diagram is used as one of the statistical charts in the business, mass media and marketing. ConceptDraw DIAGRAM provides tools for making easy drawing Circular Arrows Diagrams.
HelpDesk

How To Make an MS Visio Rack Diagram

Rack Diagram is a tool of network engineers and administrators. It should depict the structure of equipment installation, and provide the base to support electronic equipment, power, cooling, and cable management. ConceptDraw DIAGRAM allows you to easily create a diagram that will help to detail the type of rack equipment that best fits your needs and then lets you customize your installation. Choosing the right equipment will deliver better results as well as saving you time and money. ConceptDraw DIAGRAM allows you to create rack diagrams and then make an MS Visio file from diagrams in a few short steps.
HelpDesk

How To Create Visio Bubble Chart

ConceptDraw DIAGRAM allows you to easily create business charts and diagrams of any complexity, including the bubbles diagram and then make an MS Visio file from your diagram in a few simple steps.
HelpDesk

How To Create an MS Visio Block Diagram

ConceptDraw DIAGRAM allows you to easily create block diagrams of any complexity and then make an MS Visio file from your diagram in a single click.
HelpDesk

How to Create a Timeline Diagram

A Timeline is a chart which displays a project plan schedule in chronological order. A Timeline is used in project management to depict project milestones and visualize project phases and show project progress. The graphic form of a timeline makes it easy to understand critical project milestones, such as the progress of a project schedule. Timelines are particularly useful for project scheduling or project management when accompanied with a Gantt chart. It captures the main of what the project will accomplish and how it will be done. making a project timeline is one of the most important skills a project manager needs have. Making comprehensive, accurate timelines allows you getting every project off in the best way. ConceptDraw DIAGRAM allows you to draw a timeline chart using a special library.

MS Visio Look a Like Diagrams

No need for any special drawing skills to create professional looking diagrams outside of your knowledge base. ConceptDraw DIAGRAM takes care of the technical details, allowing you to focus on your job, not the drawing.
ConceptDraw DIAGRAM delivers full-functioned alternative to MS Visio. ConceptDraw DIAGRAM supports import of Visio files. ConceptDraw DIAGRAM supports flowcharting, swimlane, orgchart, project chart, mind map, decision tree, cause and effect, charts and graphs, and many other diagram types.