This site uses cookies. By continuing to browse the ConceptDraw site you are agreeing to our Use of Site Cookies.
HelpDesk

How to Create a Data Flow Diagram using ConceptDraw PRO

Data flow diagramming is a highly effective technique for showing the flow of information through a system. Data flow diagrams reveal relationships among and between the various components in a program or system. DFD is an important technique for modeling a system’s high-level detail by showing how input data is transformed to output results through a sequence of functional transformations. The set of standard symbols is used to depict how these components interact in a system. ConceptDraw PRO allows you to draw a simple and clear Data Flow Diagram using special libraries.
HelpDesk

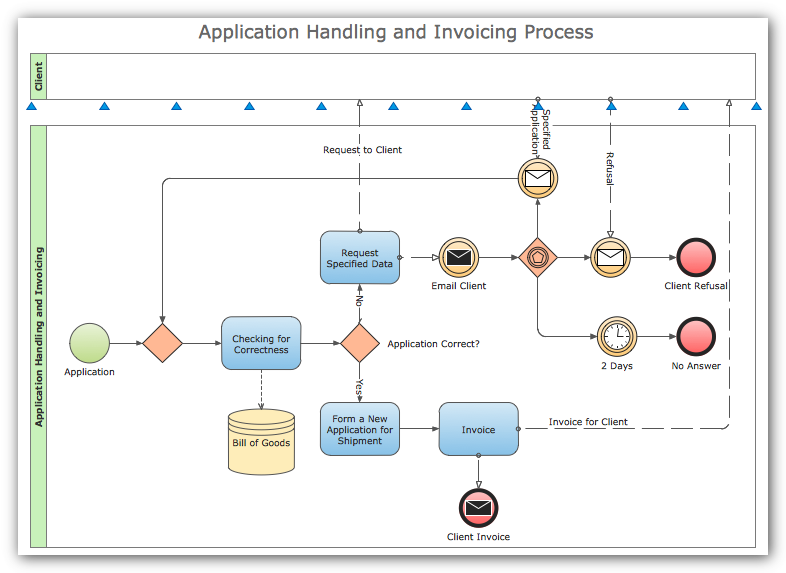
How To Create a MS Visio Workflow Diagram Using ConceptDraw PRO

A workflow diagram shows a working process as a set of related events that follow each other in a particular order.They are usually created as flowcharts, with shapes that represent steps in the process connected by arrows that indicate the next step. Making a business process diagram involves many elements that can be managed using ConceptDraw PRO. The ability to design workflow diagrams is delivered by the Workflow Diagrams solution. ConceptDraw PRO allows you to easily create workflow diagrams and then make a MS Visio file from your diagrams. Using ConceptDraw PRO, you can export your workflow diagrams to MS Visio VSDX and VDX files.
HelpDesk

How To Create a MS Visio Business Process Diagram Using ConceptDraw PRO

Business process diagrams are specialized types of flowcharts based on the Business Process Model and Notation. The BPMN specification describes the symbols to display business processes in the form of business process diagrams. The main objective of BPMN is to create a standard set of symbols that are understandable to all business users, such as business analysts who create and improve processes, technical developers responsible for implementing processes and managers who take care processes and control them. Making a business process diagram involves many different elements that can be managed using ConceptDraw PRO. The ability to design Business process diagrams is delivered by the Business Process Diagrams solution. ConceptDraw PRO supports export of business process diagrams to MS Visio files. Thus, you can share your business documentation with MS Visio users.
HelpDesk

How to Draw a Block Diagram in ConceptDraw PRO

Block diagram is a simple chart that use blocks to show some elements or activities, and connectors that show the relationship between neighboring blocks. They are commonly simple, giving an overview of a process without necessarily going into the specifics of implementation. Block diagrams are commonly used to depict a general description of a system and its activity. A most known sample of a block diagram is a flow chart, used in many types of business as a common method of representing repeated processes. Easy and a simple creation, a number of objects and connectors make the block diagram a many-sided tool for various industries. The ability to make block diagrams is delivered by the ConceptDraw Block Diagrams solution.
HelpDesk

How to Create a BPMN Diagram Using ConceptDraw PRO

Business Process Modeling Notation (BPMN) is a method of illustrating business processes in the form of a diagram. The most effective method of creating or analyzing a business process is to visually interpret the steps using a business process diagram, flowchart or workflow. This is known as business process modeling, and will be performed within a company by a team who have detailed knowledge of company process, and analysts with expertise in the modeling discipline. The objective is often to increase production or lower costs — by modeling the process initially using a flowchart, inefficiencies and problems can be spotted before committing to a decision or strategy. You can create BPMN diagrams using the ConceptDraw PRO diagramming tools. ConceptDraw have designed a solution that combines BPMN v2.0 methodology and graphical notification into one powerful package. The Business Process Diagrams solution from ConceptDraw Solution Park provides a comprehensive collection of vector
HelpDesk

Event-driven Process Chain (EPC) Diagram Software

An EPC diagram is a type of flowchart used in business process analysis. It shows different business processes through various work flows. The workflows are shown as processes and events that are related to different executes and tasks that allow business workflow to be completed.
An EPC diagram shows different business processes through various workflows. The workflows are seen as functions and events that are connected by different teams or people, as well as tasks that allow business processes to be executed. The best thing about this type of enterprise modelling is that creating an EPC diagram is quick and simple as long as you have the proper tool. One of the main usages of the EPC diagrams is in the modelling, analyzing and re-engineering of business processes. With the use of the flowchart, businesses are able to see inefficiencies in the processes and modify to make them more productive. Event-driven process chain diagrams are also used to configure an enterprise resource pla
HelpDesk

How to Diagram Sentences in ConceptDraw PRO

Diagramming sentences is a playful, fun way to learning English Grammer. Sentences can be very complex, and can contain many different parts of speech which implicate many different grammatical rules. Diagramming sentences will help you to make sure every parts of your sentence are grammatically correct, and provides you with more comprehensive understanding of the English Language. A Sentence Diagram displays the parts of a sentence as a diagram in order to show the relationship of words and groups of words within the sentence. Sentence Diagram shows the relationship between the proposal of its parts. This is a good way to teach grammar! Sentence Diagram helps to make the writing more coherent as well as more interesting to read. ConceptDraw PRO allows you to create clear sentence diagrams using the special templates and vector stencils library.
HelpDesk

How to Create a Business Process Diagram

Making a Business Process diagram involves many different elements that can be managed using ConceptDraw PRO. The ability to design Business Process diagrams is delivered by the Business Process Diagrams solution.
HelpDesk

How to Draw a Process Flow Diagram in ConceptDraw PRO

Process Flow diagrams are used in chemical and process engineering to show the flow of chemicals and the equipment involved in the process. When it comes to creating a process flow diagram, it's important to use software that is capable of describing a wide range of processes, using techniques and graphical notation that are easily recognized by engineering workers. An ideal drawing platform will utilize functions that can cope with the output of a high volume of engineering processes, that may change rapidly from development to implementation stages. ConceptDraw PRO, with the extended functionality of the Chemical and Process Engineering Diagrams solution, is the ideal medium for creating designs of this type. The Chemical and Process Engineering Diagrams solution complements this feature with a library of selected icons to represent various steps — all instantly recognizable and applicable to a wide user base. ConceptDraw PRO allows you to draw the Process Flow diagram easily using the set of special libraries.
HelpDesk

How to Create a Timeline Diagram in ConceptDraw PRO

A Timeline is a chart which displays a project plan schedule in chronological order. A Timeline is used in project management to depict project milestones and visualize project phases, and show project progress. The graphic form of a timeline makes it easy to understand critical project milestones, such as the progress of a project schedule. Timelines are particularly useful for project scheduling or project management when accompanied with a Gantt chart. It captures the main of what the project will accomplish and how it will be done. making a project timeline is one of the most important skills a project manager needs have. Making comprehensive, accurate timelines allows you getting every project off in the best way. ConceptDraw PRO allows you to draw a timeline charts using special library.
HelpDesk

How to Draw a Circular Arrows Diagram Using ConceptDraw PRO

The cyclic recurrence is a fundamental property of multiple systems. The cycle is a process which consists from elements (phases, stages, stages) following each other. Many processes in astronomy, biology, chemistry, physics, mathematics, etc. have a cycle properties. It is also widely used in information technologies and marketing analysis. Graphical representation of cyclic processes can have many forms. It can be a circle, parabola, hyperbola, ellipse and others. A Circular Arrows Diagram is used as one of the statistical charts in the business, mass media and marketing. ConceptDraw PRO provides its users tools for making easy drawing Circular Arrows Diagrams.
HelpDesk

How To Create Risk Diagram (PDPC)

Article on how to identify possible risks when carrying out corrective actions, and define preventive actions
Seven Management and Planning Tools
HelpDesk

How to Create an ERD Diagram

ERD (entity relationship diagram) is used to show the logical structure of databases. It represents the interrelationships between components of database (entities). Entity relationship diagrams are a widely used in software engineering. Using ERD software engineers can control the every aspect of database development. ER diagram can be used as guide for testing and communicating before the release of software product. ERD displays data as entities that are connected with connections that show the relationships between entities. There is some ERD notations used by data bases developers for representing the relationships between the data objects. ConceptDraw PRO and its ERD solution allow you to build ERD diagram of any notation.
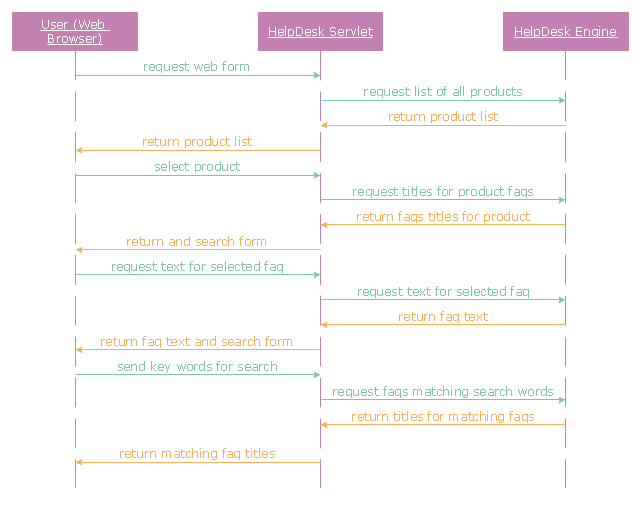
"A help desk is a resource intended to provide the customer or end user with information and support related to a company's or institution's products and services. The purpose of a help desk is usually to troubleshoot problems or provide guidance about products such as computers, electronic equipment, food, apparel, or software. Corporations usually provide help desk support to their customers through various channels such as toll-free numbers, websites, instant messaging, or email. There are also in-house help desks designed to provide assistance to employees." [Help desk. Wikipedia]
The UML sequence diagram example "Help desk" was created using the ConceptDraw PRO diagramming and vector drawing software extended with the Rapid UML solution from the Software Development area of ConceptDraw Solution Park.
UML sequence diagram
UML sequence diagram, lifeline,
HelpDesk

How to Create a Workflow Diagram Using ConceptDraw Solution Park

A workflow diagram is a specialized type of flowchart. With the help of a workflow diagram you can visually describe the tasks, documents, people responsible for execution at each stage of workflow. The ability to create Workflow diagrams is contained in the ConceptDraw Workflow Diagrams solution.