Entity Relationship Diagram Examples

ConceptDraw gives the ability to describe a database using the Entity-Relationship model. Entity-Relationship Diagram solution includes icons advocated by Chen's and Crow’s Foot notation that can be used when describing a database.

UML Use Case Diagram Example - Estate Agency
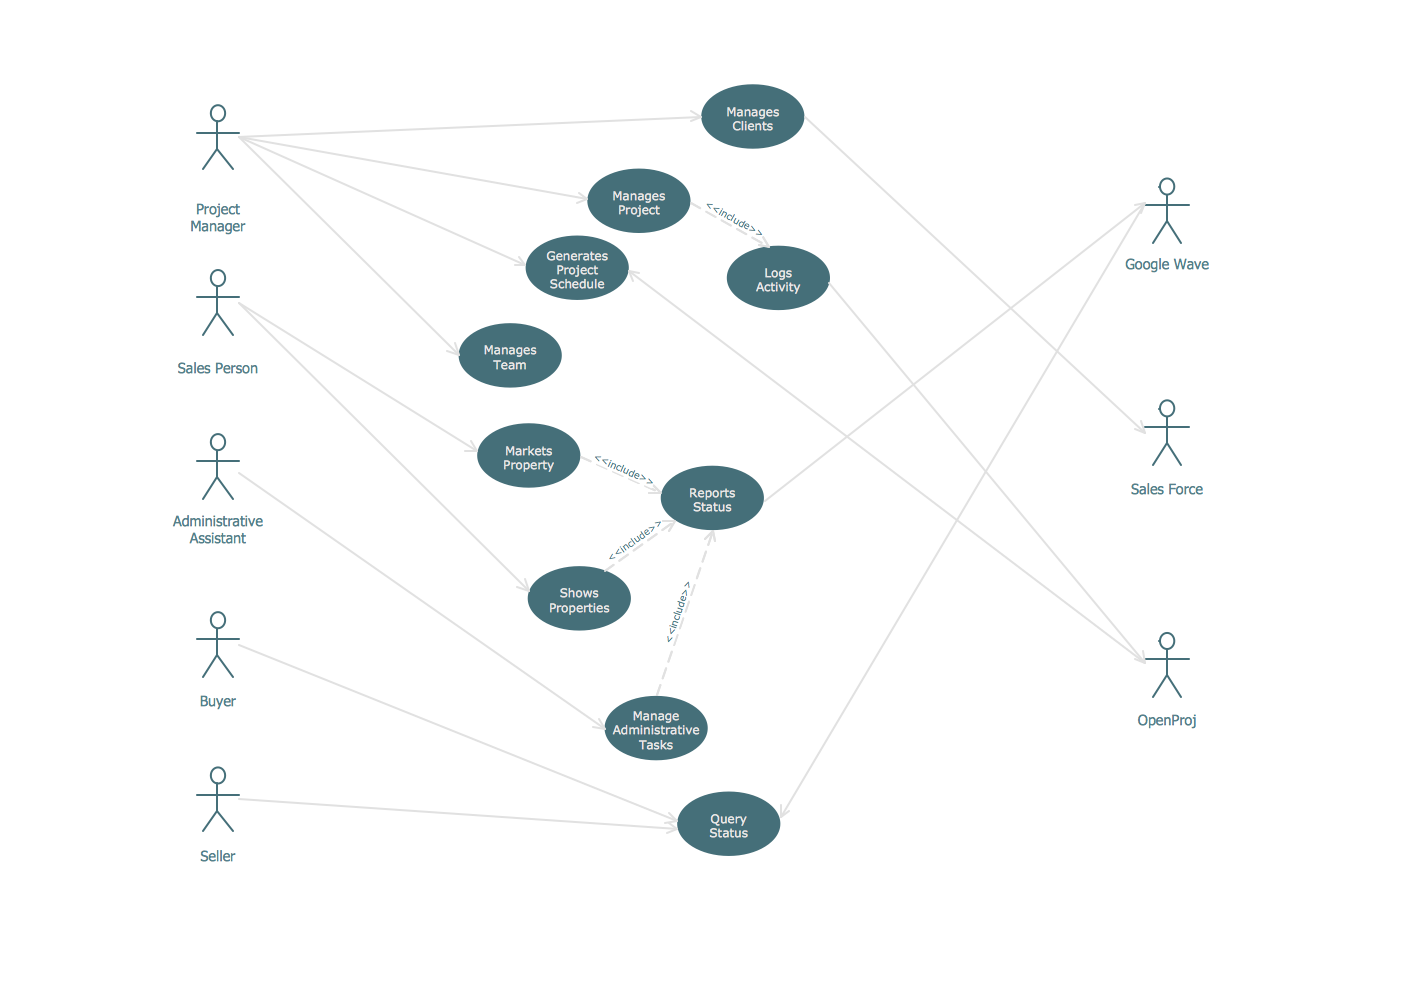
This sample shows the work of the estate agency and is used by the estate agencies, building companies, at the trainings of the estate agencies, for understanding the working processes of the estate agencies.
ConceptDraw DIAGRAM ER Diagram Tool

ConceptDraw ER Diagram Tool works across any platform, meaning you never have to worry about compatibility again. ConceptDraw DIAGRAM allows you to make Entity-Relationship Diagram (ERD) on PC or macOS operating systems.
JSD - Jackson system development

When implementing the Jackson System Development method and designing JSD diagrams, you can succesfully use the powerful and helpful tools of ConceptDraw DIAGRAM software extended with Entity-Relationship Diagram (ERD) solution from the Software Development area of ConceptDraw Solution Park.
UML Deployment Diagram
Use ConceptDraw DIAGRAM with UML deployment diagram templates, samples and stencil library from Rapid UML solution to model the physical deployment of artifacts on nodes of your software system.

UML Deployment Diagram. Design Elements

ConceptDraw has 393 vector stencils in the 13 libraries that helps you to start using software for designing your own UML Diagrams. You can use the appropriate stencils of UML notation from UML Deployment library.
Property Management Examples

This sample shows the Property Management matrix, the ideas are ordered in regards to importance and frequency. This matrix gives the ability to turn the theory into quantifiable data.
UML Class Diagram Generalization Example UML Diagrams

This sample describes the use of the classes, the generalization associations between them, the multiplicity of associations and constraints. Provided UML diagram is one of the examples set that are part of Rapid UML solution.
Diagramming Software for Design UML Activity Diagrams

UML Class Diagram Notation

- Er Diagram For Real Estate Management System
- Er Diagram For Apartment Management System
- Entity - Relationship Diagram (ERD) | Entity - Relationship Diagram ...
- Er Diagram For Property Management System
- Data Flow Diagrams And Entity Relationshi Diagram For Real Estate
- Er Diagram Dbms For Real Estate Management
- Er Diagram For Real Estate Project
- House Rental Management System Er Diagram
- Rapid UML | Data Flow Diagrams (DFD) | Entity - Relationship ...
- Data Flow Diagram Of Real Estate Project
- ERD | Entity Relationship Diagrams, ERD Software for Mac and Win
- Flowchart | Basic Flowchart Symbols and Meaning
- Flowchart | Flowchart Design - Symbols, Shapes, Stencils and Icons
- Flowchart | Flow Chart Symbols
- Electrical | Electrical Drawing - Wiring and Circuits Schematics
- Flowchart | Common Flowchart Symbols
- Flowchart | Common Flowchart Symbols