Flowchart Symbols Accounting. Activity-based costing (ABC) flowchart

Pyramid Diagram

 Accounting Flowcharts
Accounting Flowcharts solution extends ConceptDraw DIAGRAM software with templates, samples and library of vector stencils for drawing the accounting flow charts.
What process should be essentially adopted. Accounting Flowchart Example

How well does Your Purchase Process Flow?

Business Processes

Activity Network Diagram Method

This sample shows the PERT (Program Evaluation Review Technique) chart of the request on proposal. A request for proposal (RFP) is a request of the company or the organization to potential suppliers to submit the business proposals for service or goods that it is interested to purchase. The RFP is represented on the initial procurement stage and allows to define the risks and benefits.
Create Organizational Chart
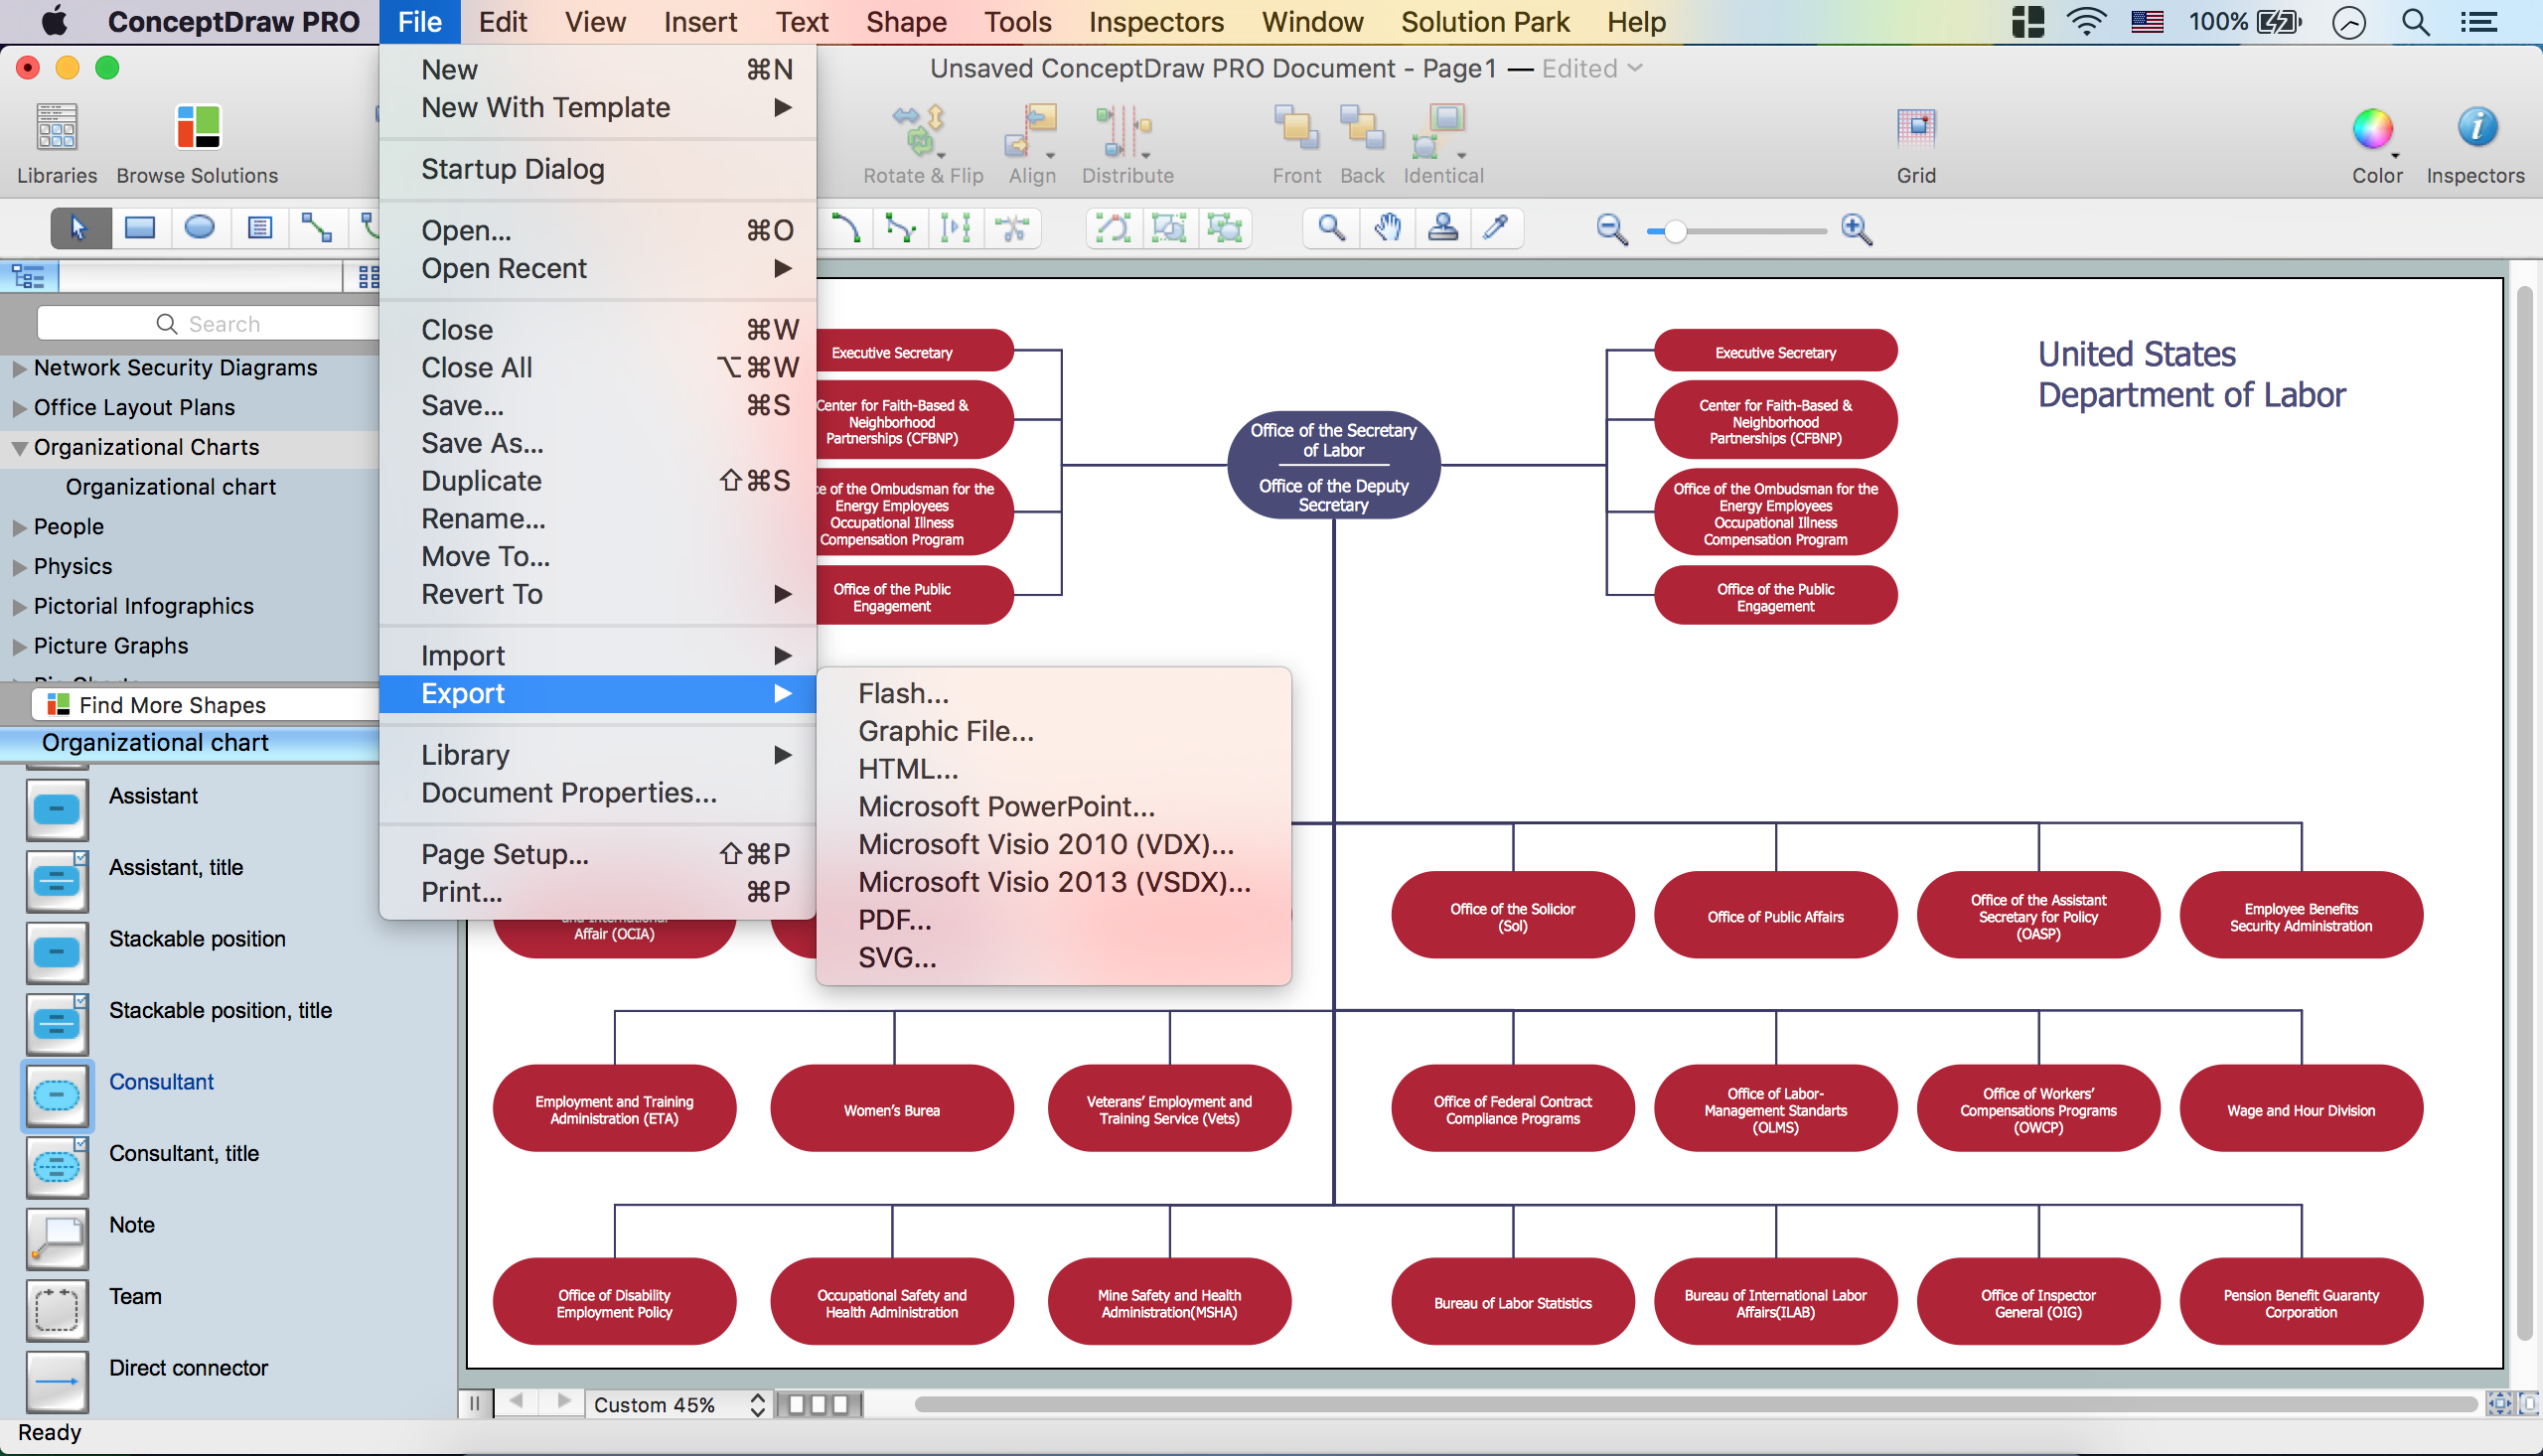
ConceptDraw DIAGRAM organizational chart professional software allows quickly create organizational charts, flow charts, time lines, and much more. Use it for drawing organizational chart for any size company and analyzing organizational structure. Use ConceptDraw to create organizational chart, visualize company Organizational chart, hospital Organizational chart, hotel Organizational chart, corporate organizational chart, etc.
Data structure diagram with ConceptDraw DIAGRAM

Why Flowchart Important to Accounting Information System?

Flowcharts are used to represent accounting information in a system. There are special symbols which are used to create accounting flowcharts. Try conceptdraw flowcharting set of symbols to draw a professional charts.
- Cost Accounting Department Manufacturing Organisation Chart
- Cost Accounting Cycle With Diagram
- Accounting Department Organizational Chart
- Organizational Charts | Draw A Typical Hotel Organization Chart
- Companies Organisation Chart And Positions Of Accountant Doc
- Flowchart Of Cost Audit
- Organizational chart - United States Department of Labor ...
- What is the Accounting Cycle? | Circular Diagram | Accounting ...
- Diagram Of A Organisational Chart Of A Manufacturing Company
- Accounts Payable Process Flow Chart | Accounting Flowchart ...
- ERD | Entity Relationship Diagrams, ERD Software for Mac and Win
- Flowchart | Basic Flowchart Symbols and Meaning
- Flowchart | Flowchart Design - Symbols, Shapes, Stencils and Icons
- Flowchart | Flow Chart Symbols
- Electrical | Electrical Drawing - Wiring and Circuits Schematics
- Flowchart | Common Flowchart Symbols
- Flowchart | Common Flowchart Symbols