Design Pictorial Infographics. Design Infographics

 GHS Hazard Pictograms
GHS Hazard Pictograms solution contains the set of predesigned standard GHS pictograms, Hazardous symbols, and Hazard communication pictograms, approved and agreed by UN in Globally Harmonized System of Classification and Labelling of Chemicals (GHS). They can be used for quick and simple designing accurate and professional-looking infographics, diagrams, warning announcements, signboards, posters, precautionary declarations, regulatory documents, and for representing the main items of OSHA HAZCOM Standard.
Sport pictograms. Olympic Games
Pictorial Chart

How to Draw Pictorial Chart. How to Use Infograms

Pictorial Infographics solution contains large number of libraries with variety of predesigned vector pictograms that allows you design infographics in minutes. There are available 10 libraries with 197 vector pictograms.
Sample Pictorial Chart. Sample Infographics

Use Pictorial Infographics solution to draw your own design pictorial infographics documents quick and easy.
 Infographics Area
Solutions of the area What is Infographics from ConceptDraw Solution Park collect templates, samples and vector stencils libraries with design elements for the drawing information graphics.
Electrical Symbols, Electrical Diagram Symbols

This solution provides 26 libraries which contain 926 electrical symbols from electrical engineering: Analog and Digital Logic, Composite Assemblies, Delay Elements, Electrical Circuits, Electron Tubes, IGFET, Inductors, Integrated Circuit, Lamps, Acoustics, Readouts, Logic Gate Diagram, MOSFET, Maintenance, Power Sources, Qualifying, Resistors, Rotating Equipment, Semiconductor Diodes, Semiconductors, Stations, Switches and Relays, Terminals and Connectors, Thermo, Transformers and Windings, Transistors, Transmission Paths,VHF UHF SHF.
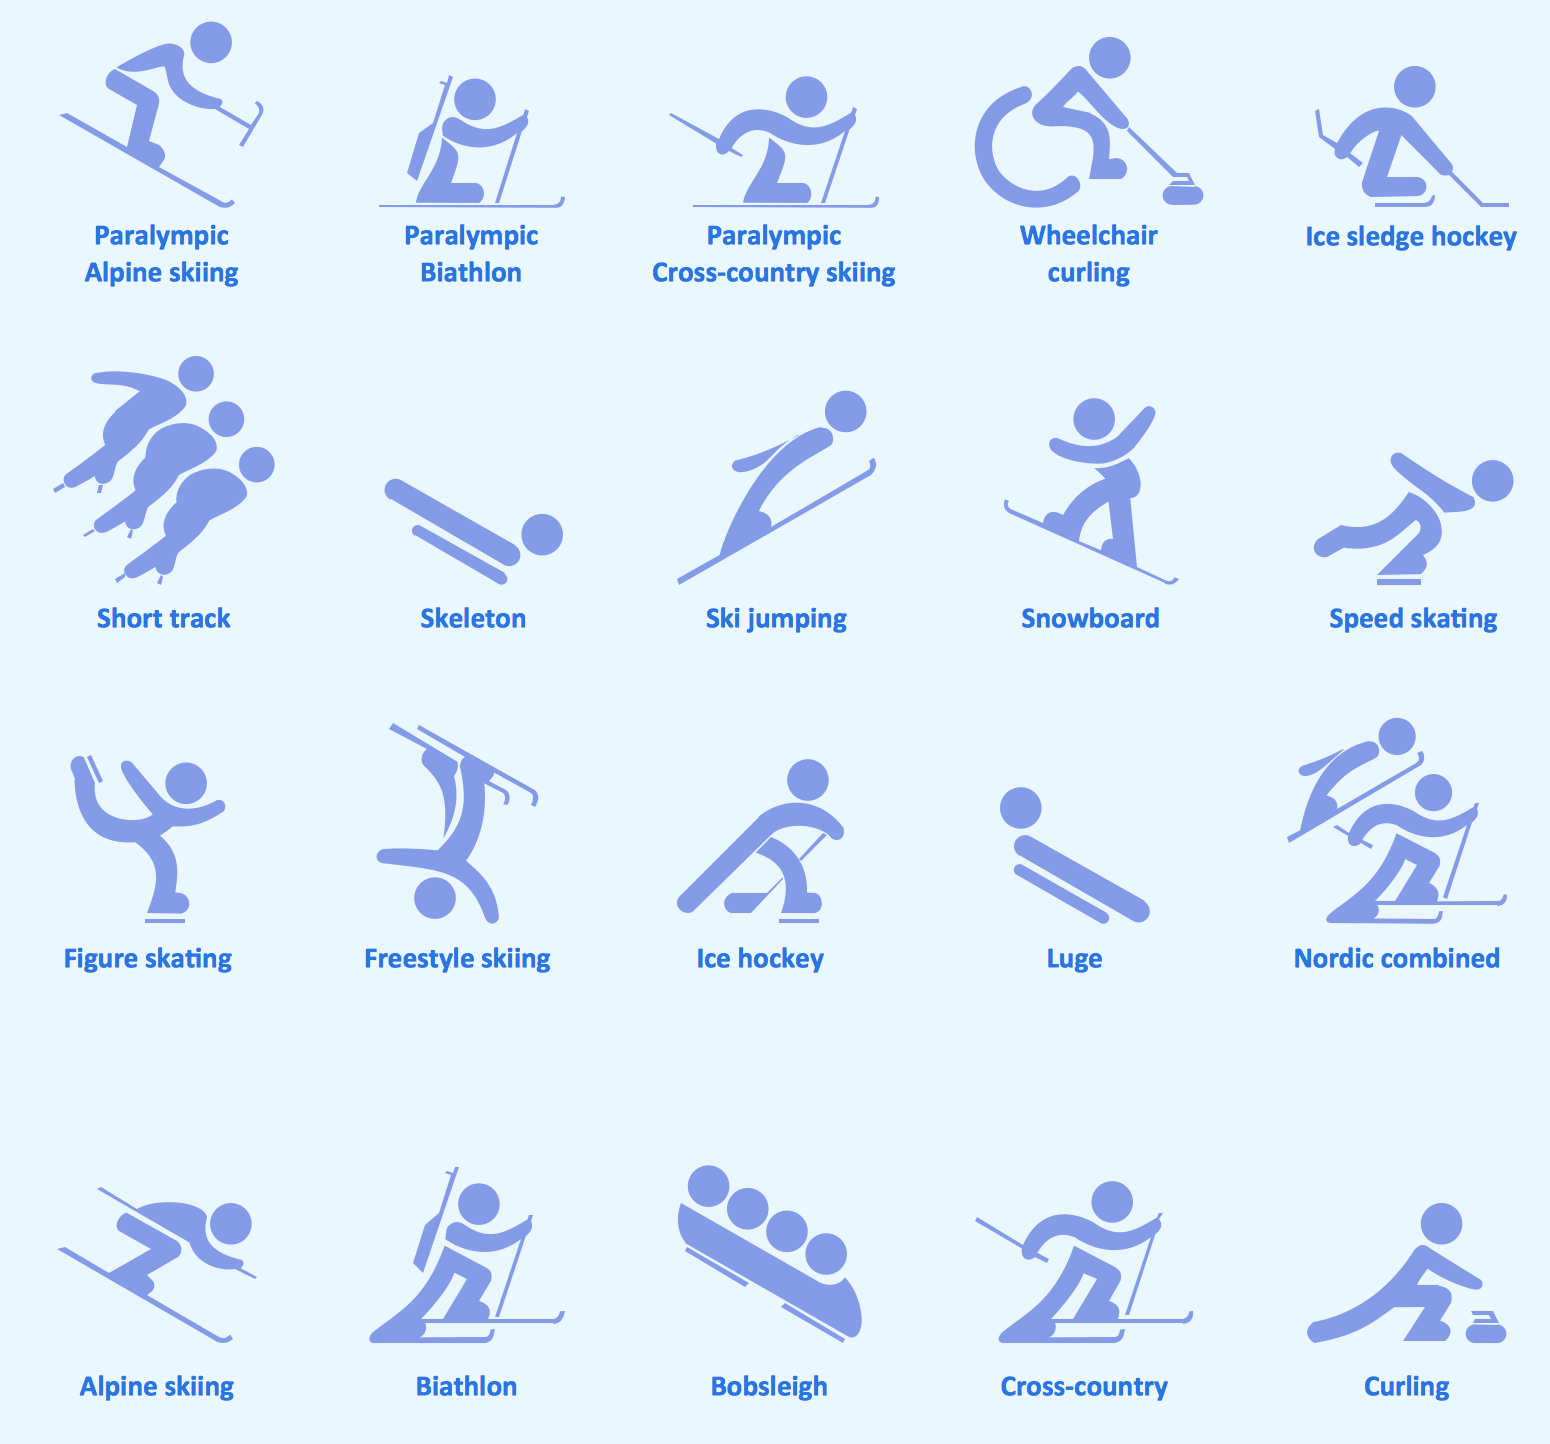
 Winter Sports
The Winter Sports solution from Sport area of ConceptDraw Solution Park contains winter sports illustration examples, templates and vector clipart libraries.
ERD Symbols and Meanings

The Chen's ERD notation is still used and is considered to present a more detailed way of representing entities and relationships.
To create an ERD, software engineers mainly turn to dedicated drawing software, which contain the full notation resources for their specific database design - ERD symbols and meanings. CS Odessa has released an all-inclusive Entity-Relationship Diagram (ERD) solution for their powerful drawing program, ConceptDraw DIAGRAM.

Network Diagramming Software for Design Computer and Network Diagrams
_Win_Mac.png)

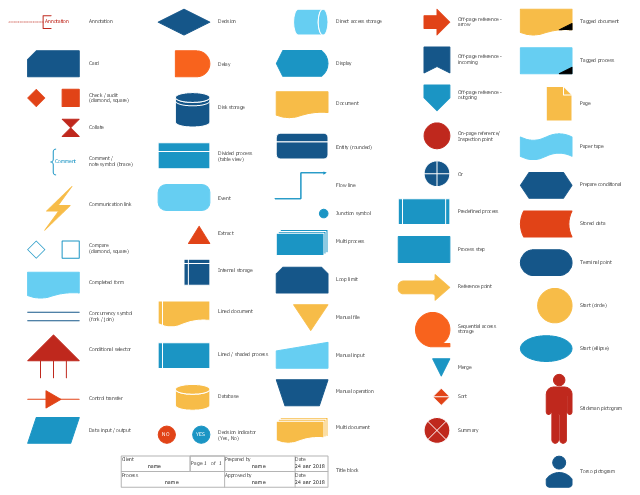
The vector stencils library "Sales flowchart" contains 62 flow chart symbols.
Use it to design your sales flowcharts, workflow diagrams and process charts by the ConceptDraw PRO diagramming and vector drawing software.
"Flowcharts are used in designing and documenting simple processes or programs. Like other types of diagrams, they help visualize what is going on and thereby help understand a process, and perhaps also find flaws, bottlenecks, and other less-obvious features within it. There are many different types of flowcharts, and each type has its own repertoire of boxes and notational conventions. The two most common types of boxes in a flowchart are:
(1) a processing step, usually called activity, and denoted as a rectangular box,
(2) a decision, usually denoted as a diamond." [Flowchart. Wikipedia]
The shapes example "Design elements - Sales flowchart" is included in the Sales Flowcharts solution from the Marketing area of ConceptDraw Solution Park.
Flowchart symbols
- Biathlon, paralympic - Winter sports pictograms | Biathlon - Winter ...
- Computer pictograms - Vector stencils library | Design elements ...
- Sport pictograms . Olympic Games | GHS Hazard Pictograms ...
- Computer pictograms - Vector stencils library | Design elements ...
- Design elements - Laboratory equipment | Education pictograms ...
- Design elements - Travel and tourism pictograms
- Design elements - Medicine and health pictograms | Medicine and ...
- Medicine and health pictograms - Vector stencils library | Design ...
- Design elements - Marketing pictograms | Design elements - IVR ...
- Music - Vector illustration | Design elements - Music | Education ...
- Pictorial Chart | Sport pictograms . Olympic Games | HR Flowchart ...
- Pictograms Design
- Health Related Pictograms
- Design Pictorial Infographics. Design Infographics | Design ...
- Design elements - IVR Internet | Design elements - Marketing ...
- Sport pictograms . Olympic Games | Transport pictograms - Vector ...
- Sport pictograms . Olympic Games | Design Pictorial Infographics ...
- Transport pictograms - Vector stencils library | Design elements ...
- Infographics Pictograms
- Sport pictograms . Olympic Games | Winter Sports. Using Winter ...
- ERD | Entity Relationship Diagrams, ERD Software for Mac and Win
- Flowchart | Basic Flowchart Symbols and Meaning
- Flowchart | Flowchart Design - Symbols, Shapes, Stencils and Icons
- Flowchart | Flow Chart Symbols
- Electrical | Electrical Drawing - Wiring and Circuits Schematics
- Flowchart | Common Flowchart Symbols
- Flowchart | Common Flowchart Symbols