How should diagramming software work? Is it possible to develop a diagram as quickly as the ideas come to you?
The innovative ConceptDraw Arrows10 Technology included in ConceptDraw DIAGRAM is a powerful drawing tool that changes the way diagrams are produced.
While making the drawing process easier and faster.
ConceptDraw DIAGRAM is a powerful tool that helps you create a process map diagram quickly and easily. Fine-tuning the objects in ConceptDraw DIAGRAM allows you to create a really professional finished article.ConceptDraw Arrows10 Technology gives drawing connectors a smart behavior that provides quick and precise placement, allows for easy changes and automatic rearrangement.
An organizational chart is a diagram that shows the structure of an organization. It shows the relationships and relative ranks of the company′s parts and positions.
The most common type of organizational chart is hierarchical, which has a tree structure.
Tree Auto-connection mode allows you to draw an organizational chart in moments. Thanks to ConceptDraw Arrows10 Technology you don′t need to concern yourself with technical points like how to connect or place objects. Your only concern is what to draw. Everything else is taken care of by ConceptDraw professionals.
Let′s see how it works when creating organizational charts.
It helps you to show the relationships of positions in an organization in terms of authority and responsibility. Orgcharts are typically used to provide both employees and individuals outside of the organization with a “snapshot” picture of the reporting relationships, divisions of work and levels of management.
Sample 1. Organization Chart County Administrator Office
All source documents are vector graphic documents. They are available for reviewing, modifying, or converting to a variety of formats (PDF file, MS PowerPoint, MS Visio, and many other graphic formats) from the ConceptDraw Solution Park. The Organizational Charts Solution is available for all ConceptDraw DIAGRAM users.
A flowchart is a simple but very functional tool when it comes to understanding a workflow or to removing unnecessary stages from a process. When drawing flowcharts, keep in mind that there are four common types of flowcharts, like document flowcharts and data flowcharts that show control over a data or document flow over a system. To show controls on a physical level, use system flowcharts. In addition, to show controls in a program, you can draw a program flowchart.
This flowchart diagram represents the piece of an article editing process, that involves the author and editor. It was created using the Basic Flowchart notation that consists from the basic flowchart symbols. The start and the end of the process are indicated with "Terminator" symbols. The "Process" symbols show the action steps consisting from making edits and searching for a compromise, when the author does not agree with the suggestions of the editor. The "Process" symbol is the general symbol in process flowcharts. The "Decision" symbol indicates a branching in the process flow. There are two branches indicated by a Decision shape in the current flowchart (Yes/No, Disagree/Agree). This basic flowchart can be used as a repeating unit in the workflow diagram describing the working process of some editorial office.
Sometimes it's difficult to find a path in work processes or to understand the requirements, especially when you are a newcomer. To get your thoughts straight, create a workflow diagram, and put everything on it. This will not only help you to get into the workflow, but also show it’s weaknesses.
This illustration captures the workflow process of payment an invoice for the electricity consumed by certain enterprise. It was drawn in ConceptDraw DIAGRAM using its solution for Workflow Diagrams. Making a workflow charts means that you need to depict consistently all processes engaged to the workflow process. Then, you should connect them with symbols meaning study and analysis. Next, add symbols of decisions. A work flow diagram made precisely and correctly can help to clarify your work flow to any person.
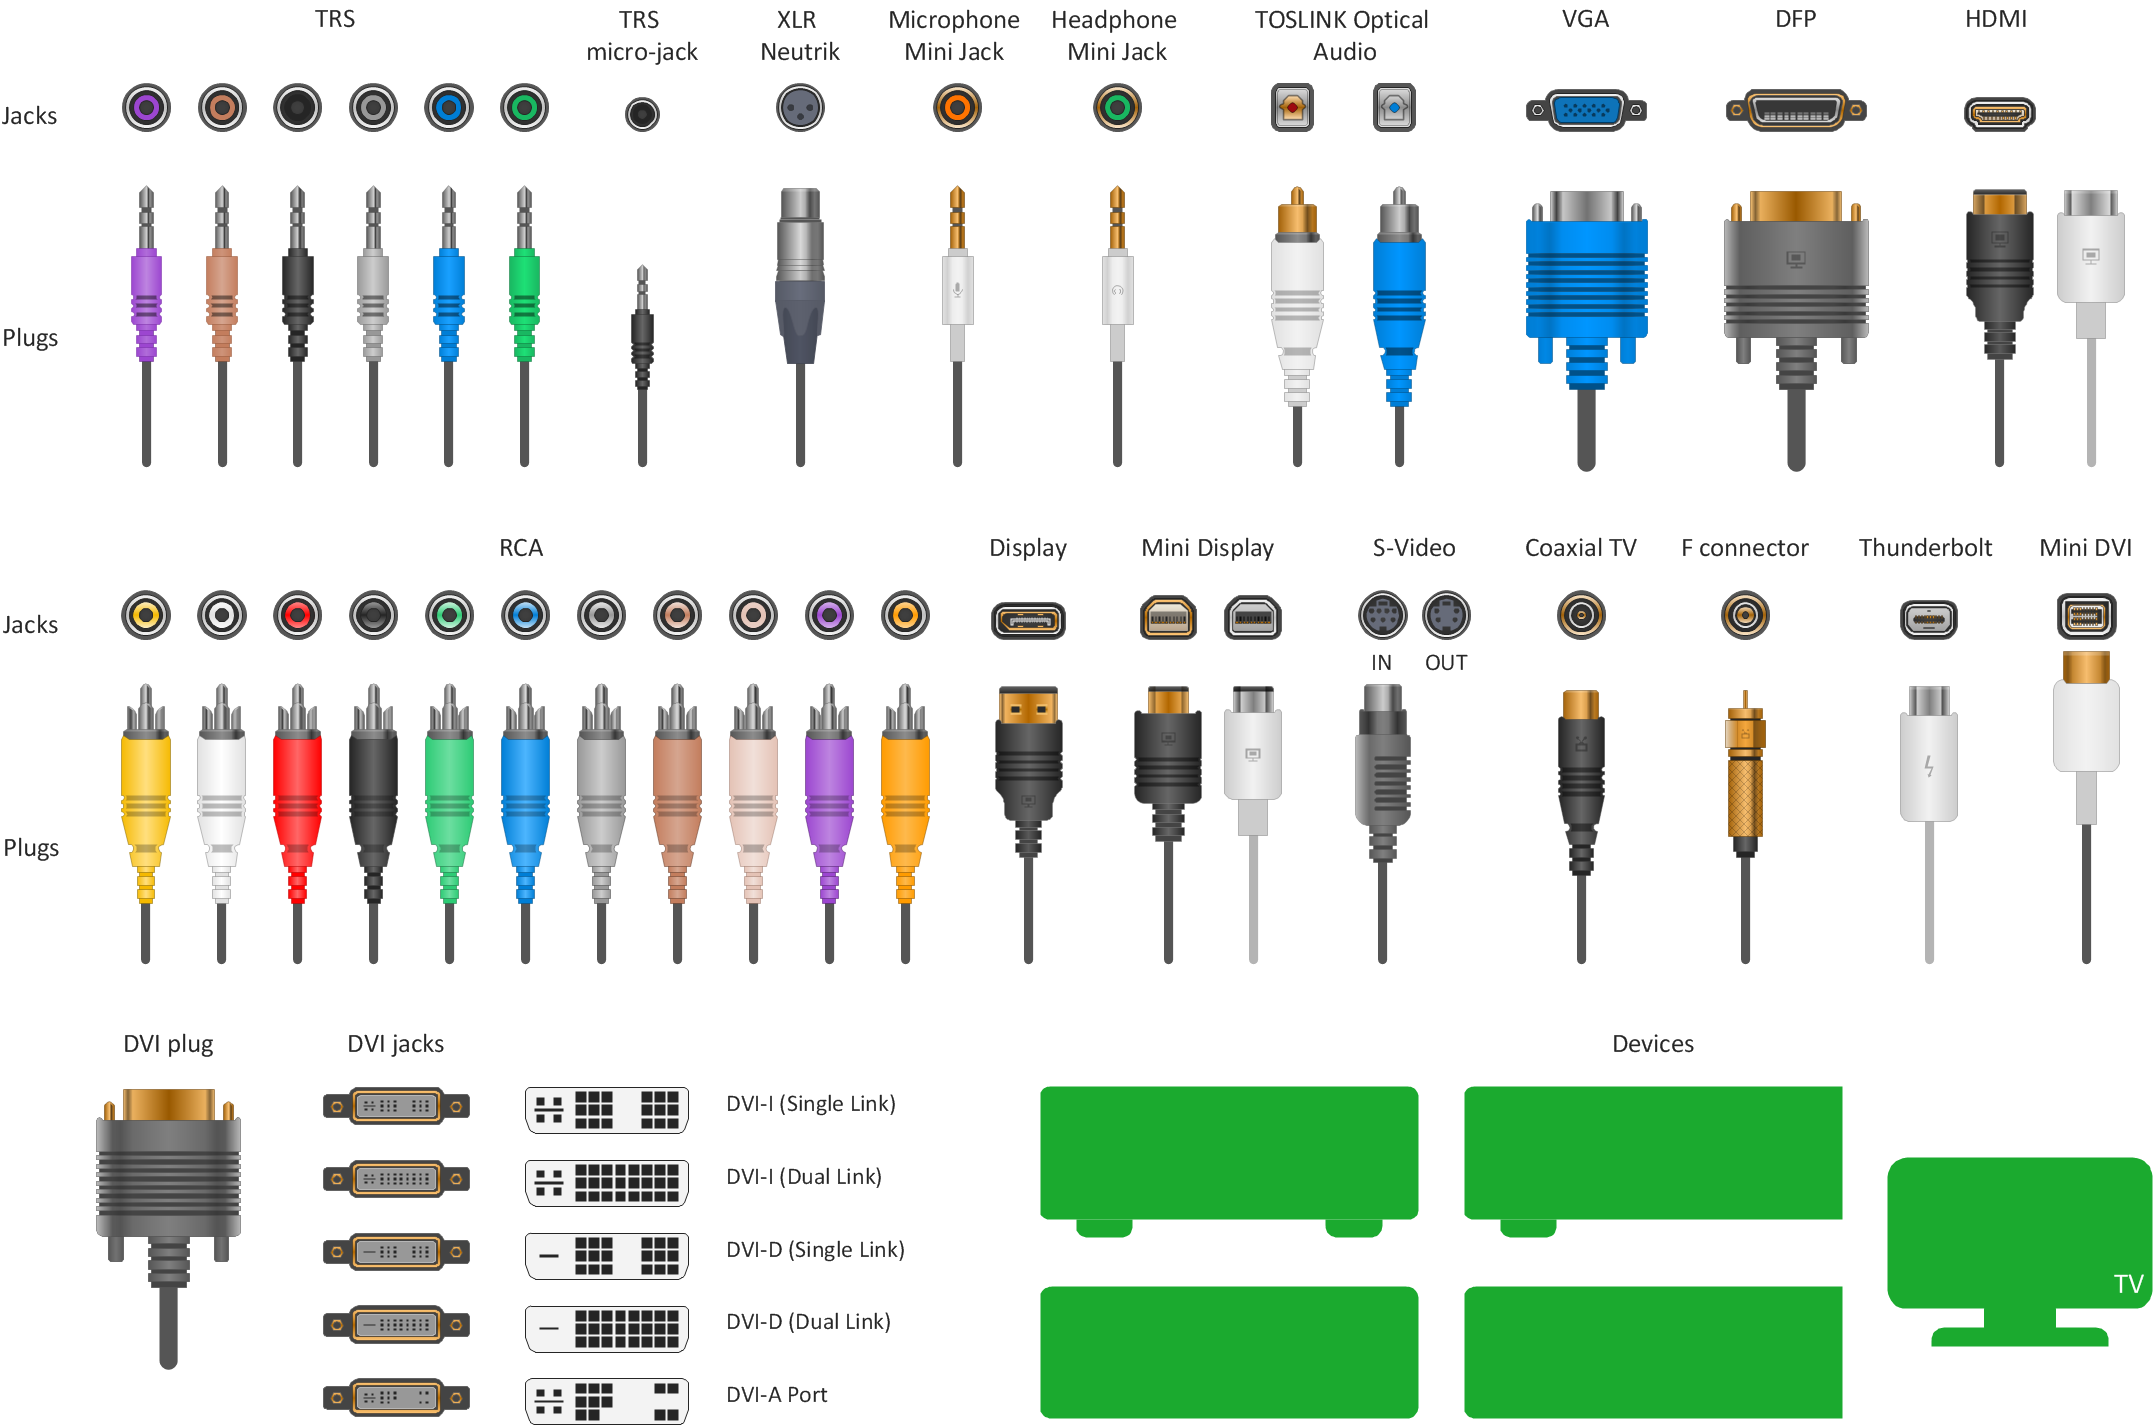
Use the ConceptDraw DIAGRAM software that has vector clipart of numerous cable connectors, examples, and templates for drawing different types of audio and video connection diagrams. Paste icon of the receiver or another device to page and layout sockets and plugs. Further connect plugs with each other, and now you have well-designed connection diagram.
This sample was created in ConceptDraw DIAGRAM diagramming and vector drawing software using the Flowcharts solution from the Diagrams area of ConceptDraw Solution Park.
This sample shows the Flowchart of the Subprime Mortgage Crisis. This Flowchart describes the decline in housing prices when the housing bubble burst and what it caused on the housing and financial markets. You can also see the Government and Industry responses in this crisis situation.
Fast visualization of structured data is main capability of the ConceptDraw DIAGRAM. With numerous vector stencils and standard flowchart symbols from object libraries and the RapidDraw technology this program stands as the best professional flowchart software for drawing with type of flowchart symbols. ConceptDraw DIAGRAM also known as best flowchart maker.
Picture: Easy Flowchart Program and Standard Flowchart Symbols
This sample was created in ConceptDraw DIAGRAM diagramming and vector drawing software using the Organizational Charts Solution from the Software Development area of ConceptDraw Solution Park.
This sample shows the organizational chart in the field of Architect Engineering. Create your own orgchart professional drawings using ConceptDraw.
Venn diagrams are illustrations used in the branch of mathematics known as set theory.
Use ConceptDraw DIAGRAM to quick and easy design your own Venn Diagram of any complexity.
Describing a workflow or approval process can take hours and be too complicated, especially since there are options to do it quickly and vividly. Diagrams called flowcharts replace long paragraphs of boring text and represent information in a graphic way. You can draw one on paper or you can use flowchart software to do it quickly and scalable. This kind of software is easy to use and you don’t need any special skills to start using it. In addition, there are a lot examples and predesigned templates on the Internet.
Flowcharts are a best tool for staking out a huge and complex process into some small readable parts. Surely, flowcharts can be drawn manually but the use of standard symbols that make it clear for a wide audience makes a software tool preferred for this task. The core for a successful flowchart is its simplicity. That is why often before beginning making flowchart through software, people draw the sketch on a piece of paper. Designing an effective flowchart means the combination of the data needed to be shown and the simplicity with which you depict it.
ConceptDraw MINDMAP has a new challenges in leading or taking instruction during remote mind map presentation and available to deliver lessons to a remote group via a Skype conference call. ConceptDraw DIAGRAM provides tools to develop a response flowchart that can be connected with Action Mind Maps.