Graphical User Interface Examples
The graphical user interface (GUI) a visual way of interacting with a computer through graphical icons and visual indicators, used by most modern operating systems.
ConceptDraw DIAGRAM extended with Windows 8 User Interface solution from the Software Development area is the best gui software.
Using the drawing tools, libraries of vector objects, graphical user interface examples that offers Windows 8 User Interface solution, you will easily design the Windows 8 user interfaces and Windows 8 UI design patterns of any complexity.
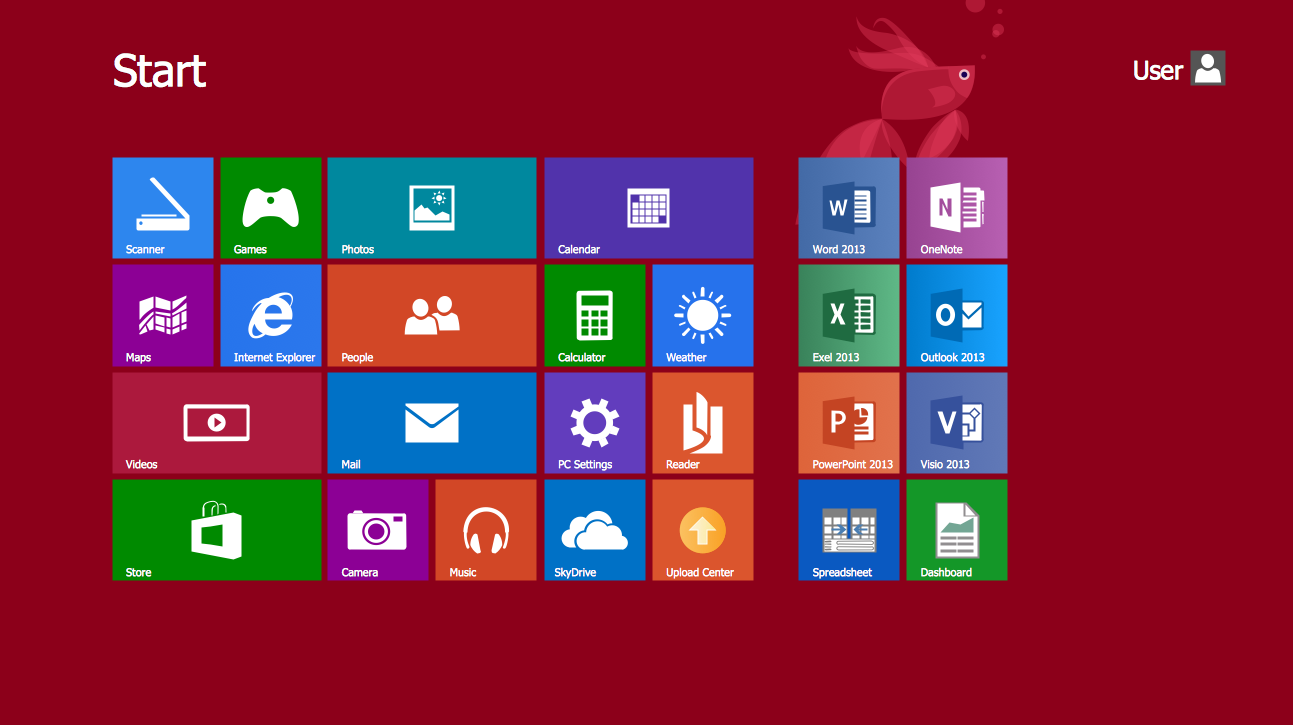
Example 1. Graphical User Interface Examples — Windows 8 Start Screen
14 libraries of Windows 8 User Interface Solution offers you all needed vector objects of Windows 8 interface's elements:
- Window Elements
- Windows 8 Backgrounds
- Windows 8 Apps
- Windows 8 Icons
- Windows 8 Round Icons
- Windows 8 Controls
- Windows 8 Progressive Disclosure Controls
- Windows 8 Interactions
- Windows 8 Menus
- Windows 8 Messages
- Windows 8 Toolbars
- Windows 8 Ribbons
- Windows 8 Text
- Windows 8 UI

Example 2. Graphical User Interface Examples — Windows 8 PC Settings
Nothing could be easier than drag just ready predesigned vector objects from the Windows 8 User Interface solution libraries and quickly arrange them as you need. You can also change the colors, text, and use the objects from numerous libraries of other solutions of ConceptDraw Solution Park.

Example 3. Graphical User Interface Examples — File Menu
The graphical user interface examples you see on this page were created in ConceptDraw DIAGRAM using the vector objects from the libraries of Windows 8 User Interface Solution for ConceptDraw DIAGRAM All these examples are available for viewing and editing from ConceptDraw STORE.
All source documents are vector graphic documents. They are available for reviewing, modifying, or converting to a variety of formats (PDF file, MS PowerPoint, MS Visio, and many other graphic formats) from the ConceptDraw STORE. The Windows 8 User Interface Solution is available for all ConceptDraw DIAGRAM or later users.
TEN RELATED HOW TO's:
Android is a mobile operating system (OS) based on the Linux kernel and currently developed by Google.
One of the most important features of any Android app is, of course, its Android User Interface. It is all what the user sees on the screen of its device and interacts with. Creating of successful Android User Interface and developing Android UI prototypes may be the mighty task. But we recommend you to make it fast and easy in ConceptDraw DIAGRAM specially extended with Android User Interface Solution from the Software Development Area.
Picture: Android User Interface
Related Solution:
To see how your business can improve you can try data visualization software solutions that allows you visualize all your sales KPI in one sales dashboard allows you monitor and analyse sales activities.
Picture: Data Visualization Software Solutions
Process Flow Chart is a visual illustration of overall flow of activities in producing a product or service. How do you make a Process Flow Chart usually? Drawing process flow charts, diagrams and maps is quite complex and lengthy process, especially if you draw free-hand. But now thanks to the ConceptDraw DIAGRAM diagramming and vector drawing software extended with Flowcharts solution from the Diagrams area of ConceptDraw Solution Park this process became simple and fast. A confirmation of this can serve many Process Flow Chart examples included in Flowcharts solution.
Picture: Process Flow Chart Examples
Related Solution:
If we divide computer networks by scale, we get several main categories. The smallest network is PAN, as it connects personal devices themselves, and as the number of users grows, a local area network can be recognized, and campus area networks (CAN) connects several local networks located within some area like a university or a corporation. Computers connected to CAN share public educational materials and list of CAN network examples includes such prestigious universities like Stanford and Carnegie Mellon.
This is an example of a computer network diagram created for a campus area network. It was created using using ConceptDraw solution for the Computer and Network diagramming. The specific of this sample campus network is its distribution. It is rather broad to embrace a big campus territory. This diagram can be applied as a template for designing custom area network topology diagram for a particular educational institution.
Picture: Campus Area Networks (CAN). Computer and Network Examples
Related Solution:
The best bar chart software ever is ConceptDraw. ConceptDraw bar chart software provides an interactive bar charting tool and complete set of predesigned bar chart objects.
Picture: Bar Chart Software
Related Solution:
When you need to visually represent the structure of relational database, Entity relationship diagram (ERD) is a type of diagram for that case.
Most entity-relationship diagrams can be built with objects from Flowchart solution or ERD Solution which contains inbuilt templates. Follow these steps to create your own custom ERD diagram.
Don't be frightened if it looks complex, ConceptDraw DIAGRAM makes it easy to create an ERD, and hundreds of other diagrams, in minutes.
Picture: Developing Entity Relationship Diagrams
Related Solution:
Microsoft Azure is widely used cloud platform which was created by Microsoft and now is managed by Microsoft datacenters in 19 regions of the world, and has a wide set of benefits and features.
ConceptDraw DIAGRAM diagramming and vector drawing software extended with Azure Architecture Solution from the Computer and Networks area of ConceptDraw Solution Park is the best for designing various pictorial infographics, illustrations and materials showing the possibilities and work of Microsoft Azure Cloud System and Azure services.
Picture: Microsoft Azure
Related Solution:
ConceptDraw DIAGRAM is the world’s premier cross-platform business-diagramming tool. Many, who are looking for an alternative to Visio, are pleasantly surprised with how well they can integrate ConceptDraw DIAGRAM into their existing processes. With tens of thousands of template objects, and an easy method for importing vital custom objects from existing Visio documents, ConceptDraw DIAGRAM is a powerful tool for making extremely detailed diagrams, quickly and easily.
Picture: ConceptDraw DIAGRAM : Able to Leap Tall Buildings in a Single Bound
Related Solution:
Engineering students usually have huge amount of homework. Learning how to develop a technical drawing is one of the necessary skills. Luckily, at the present time, there’s no need to draw it on paper, because there a lot of software tools for it.
This drawing represents the Bearing symbols library, that is the part of the ConceptDraw Mechanical Engineering solution. Bearings are the important components of any movable mechanism. The function of bearing is to align, guide, and support the moving parts in any mechanical construction. Usually they are located between moving and stationary parts, it works as a connection point between them. Using Mechanical Engineering solution and ConceptDraw DIAGRAM one can effortlessly draw engineering diagrams of any complexity.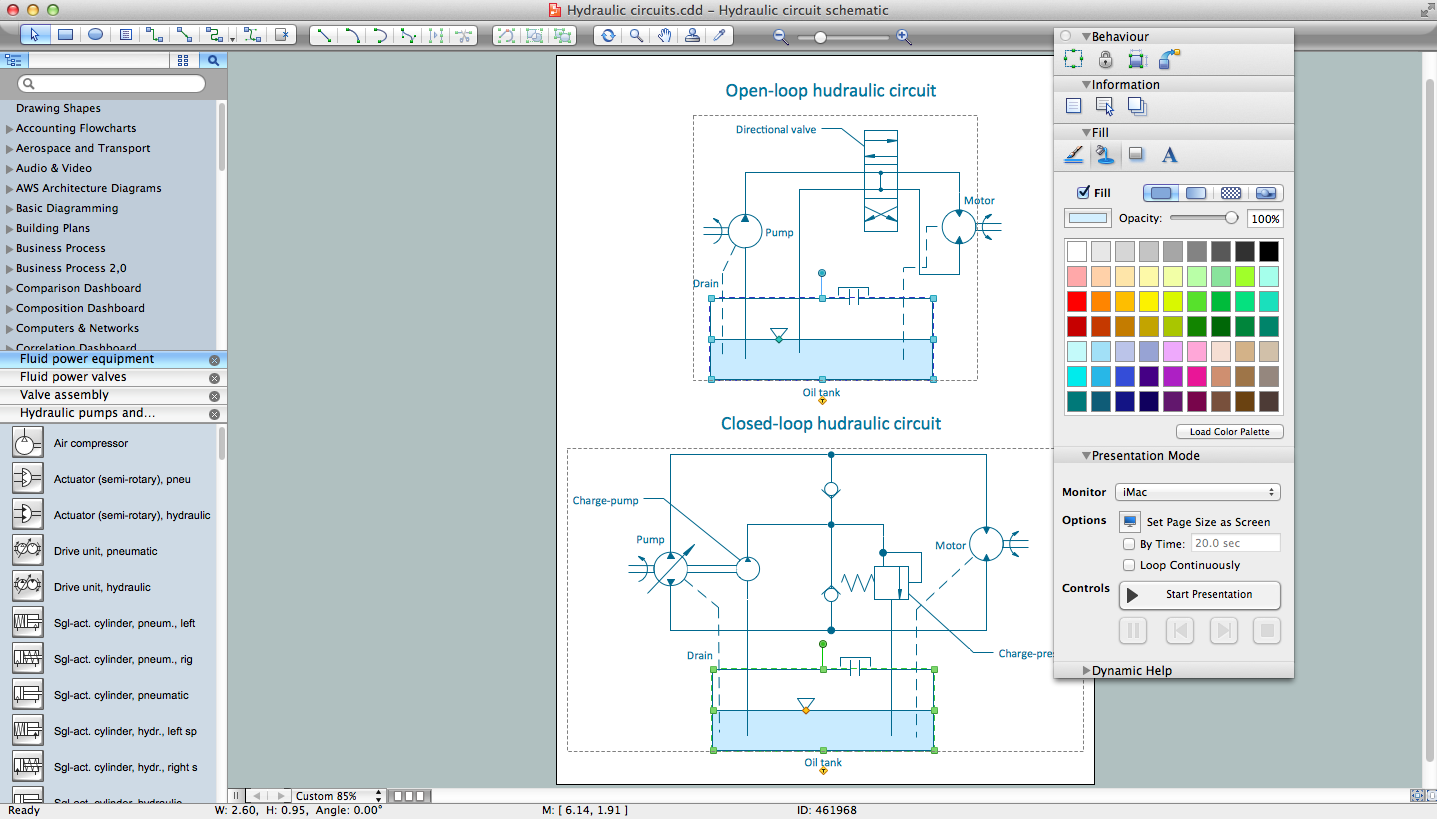
Picture: Technical Drawing Software
Related Solution:
There are many ways to define the flow of information within a system. Structured-systems analysis method often uses data flow diagrams to show data flow, data storages and data processing visualization. These diagrams are easy to develop and quite useful.
Here is a dataflow diagram presenting an example of the manufacturing process flow. The oval process shapes represent a process that controls data within the current system. The process may produce data or make some action based on data. Data flows are represented by lines. They show the movement of information through the system. The direction of the data flow is depicted by the arrow. The external entities are shown by rectangles. They represent the external entities interacting with the system. The data store objects (unclosed rectangles) are used to show data bases participating in a process flow.
Picture: Data Flow Diagram
Related Solution:

