Flowchart Symbols: Meaning and Examples
Flowchart symbols are standardized diagram shapes used to represent actions, decisions, inputs, outputs, and connections in a process. Understanding these symbols helps professionals interpret workflow logic and process structure.
Also called: Also called flowchart shapes or process flow symbols.
5 basic symbols: Start/End, Process, Decision, Input/Output, Flowline.
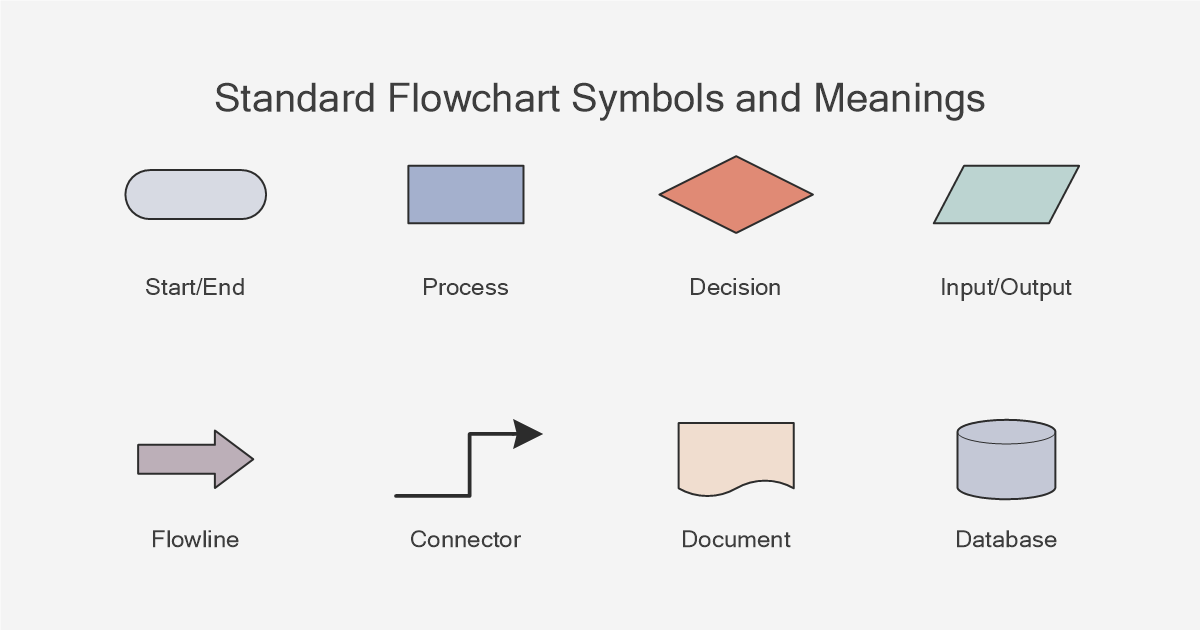
View full-size flowchart symbols overview
This visual provides a quick reference to the core symbols most commonly used in standard process diagrams.
Complete List of Flowchart Symbols
The most common flowchart symbols represent standard actions and decisions within a process. The table below summarizes the primary symbols used in business, technical, and workflow diagrams.
New to flowcharts? Start with our flowchart guide. Want to build one fast? Try the flow chart creator.
Next: a quick definition, the core symbols, and a cheat sheet you can copy into documentation.
Types of Flowchart Symbols
Flowchart symbols can be grouped into several functional categories:
- Process symbols — actions and operations
- Decision symbols — conditional logic and branching
- Input/output symbols — data interaction
- Flow control symbols — direction and connections
- Storage and document symbols — data and artifacts
With the main symbol groups outlined above, the next sections move into quick definitions, detailed symbol explanations, and a cheat sheet you can use in documentation and diagram reviews. For quick diagram creation, see the flow chart creator.
What Are Flowchart Symbols?
Flowchart symbols are standardized diagram shapes used to visualize how a process works. Each symbol has a defined meaning — for example, a rectangle represents a process step, a diamond represents a decision, and a parallelogram represents input or output.
- Rectangle: process step
- Diamond: decision
- Parallelogram: input/output
- Oval: start/end
Tiny example: Start → Process → Decision (Yes/No) → End. This simple pattern shows how the most common symbols work together in a standard process flow.
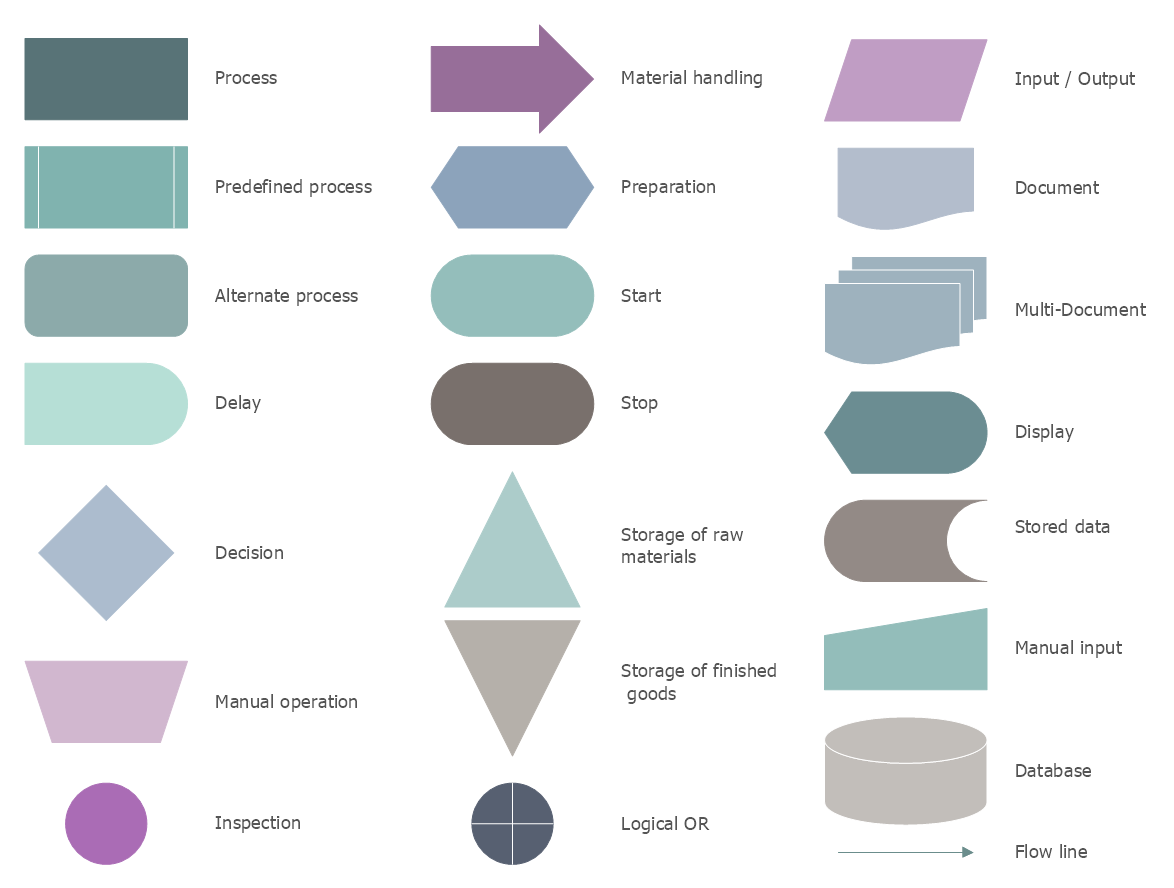
Core Flowchart Symbols and Meanings
Below are the most common flowchart shapes and their meaning in process diagrams. For a full walk-through, see what a flowchart is.
Start/End (Terminator)
Meaning: Indicates where a process begins or ends. Often shown as an oval, lozenge, or rounded rectangle.
- When to use: At the start and end of a flow or a clearly defined sub-process.
Labeling tip: Use short action phrases such as “Start”, “Submit request”, or “Receive product”.
Tiny example: Start → Process → End
Process (Rectangle)
Meaning: Represents a single action, task, or operation in the process.
- When to use: For each distinct step such as “Validate data”, “Send email”, or “Save changes”.
Labeling tip: Use verb + object, for example “Approve order”.
Tiny example: Start → Process → Process → End
Decision (Diamond)
Meaning: A branching point where the next step depends on a condition, often Yes/No or True/False.
- When to use: When the flow must split into alternative paths based on a rule or question.
In real-world business process diagrams, decision symbols typically represent approval steps, validation checks, and conditional routing logic within structured workflows.
Complex decisions with multiple outcomes are often simplified or broken into smaller decision points to maintain clarity.
Labeling tip: Always label outgoing arrows, for example Yes/No or True/False.
Tiny example: Process → Decision → (Yes) Process / (No) End
Input/Output (Parallelogram)
Meaning: Data entering the process or leaving it, such as user input or displayed results.
- When to use: For “Get X from user”, “Display X”, “Export report”, and similar steps.
Labeling tip: Name the data clearly, for example “Customer details”.
Tiny example: Input → Process → Output
Flowline / Arrow
Meaning: Shows direction and sequence — how control moves from one step to the next.
- When to use: Between every connected step; keep direction consistent, usually top-down or left-to-right.
Labeling tip: Only label arrows when meaning is not obvious, especially after decisions.
Tiny example: Process → Decision → Process
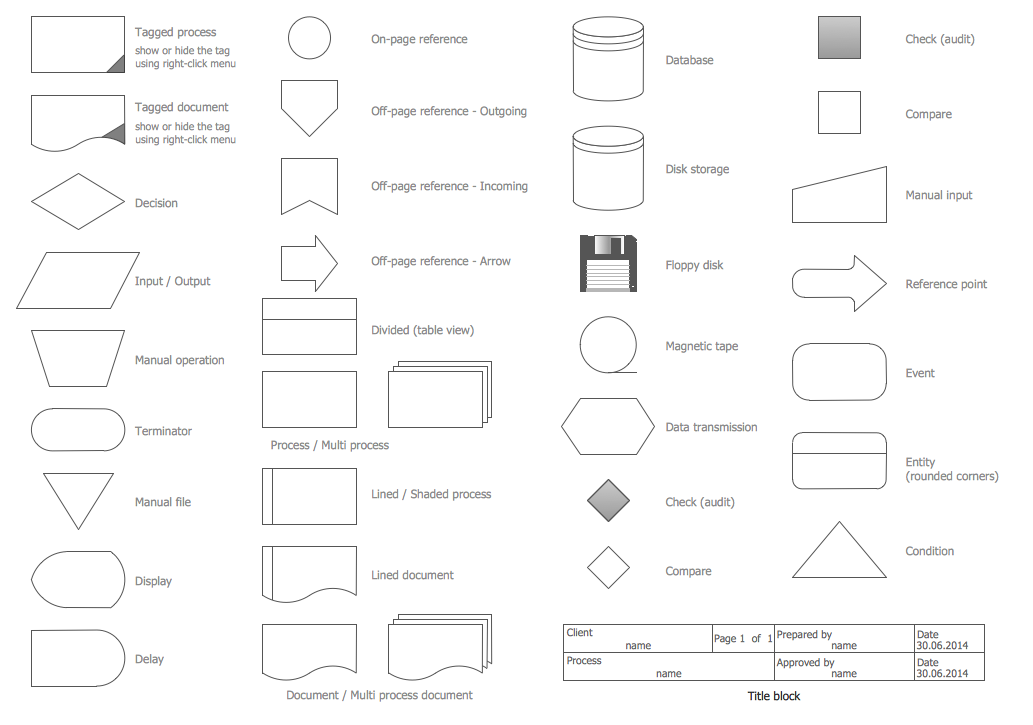
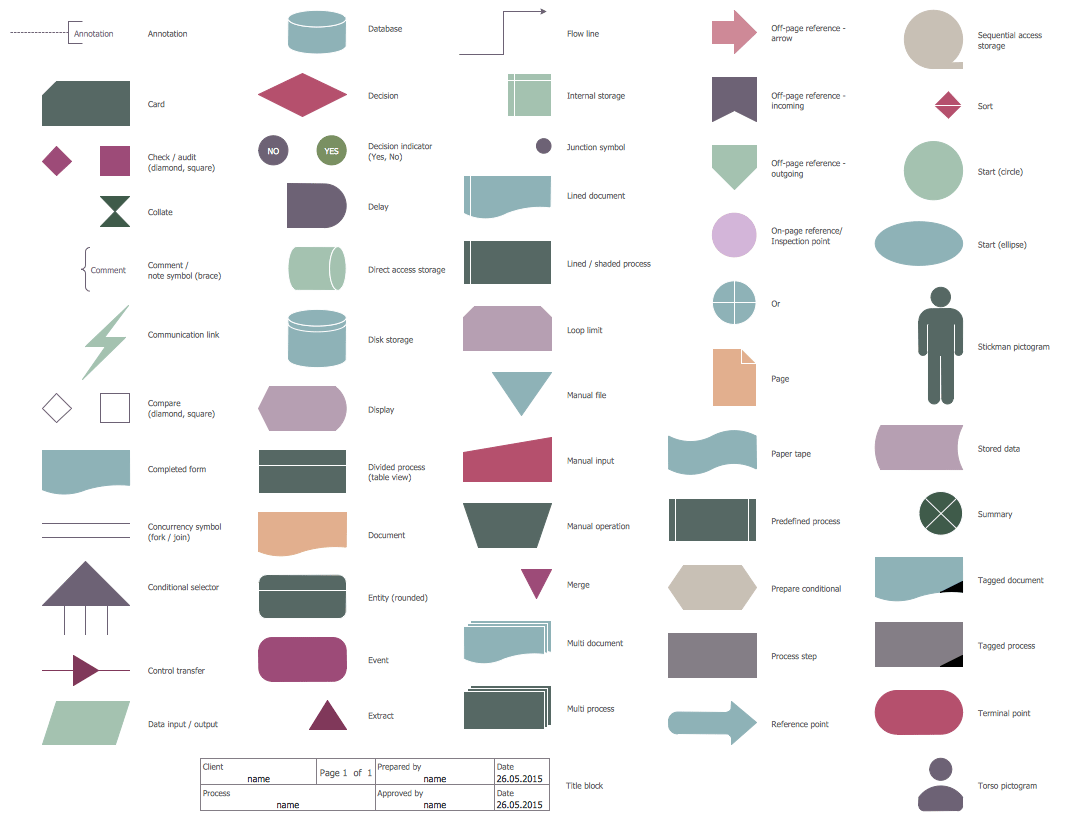
Connector (On-page / Off-page)
Meaning: Helps keep large flowcharts readable by linking separated parts of a diagram on the same page or continuing on another page or screen.
- When to use: When lines would cross too much, or the diagram must span multiple pages.
Labeling tip: Use matching labels such as A/A or 1/1, or other clear references.
Tiny example: Process → Connector (A) … Connector (A) → Process
Document
Meaning: Represents a document or report used or produced during a process, whether paper or digital.
- When to use: When a step creates, reads, reviews, sends, or stores a form, invoice, contract, or report.
Labeling tip: Name the document clearly, for example “Invoice”, “Signed contract”, or “Monthly report”.
Tiny example: Process → Document → Process
Database / Data Store (Cylinder)
Meaning: Stored data that the process reads from or writes to, such as a database, system of record, or repository.
- When to use: When the flow saves data, retrieves records, or persists results.
Labeling tip: Specify the store, for example “CRM database”, “Order DB”, or “File archive”.
Tiny example: Process → Database → Process
Predefined Process / Subprocess
Meaning: A named process step that expands into its own detailed flowchart elsewhere.
- When to use: When you want to keep the main diagram simple while referencing a repeatable procedure.
Labeling tip: Use a stable name and link or reference the detailed diagram, for example “User verification subprocess”.
Tiny example: Start → Subprocess → Decision → End
Delay
Meaning: A waiting period before the next step happens, such as a time-based hold, queue, or cooling-off period.
- When to use: When time is a real part of the process, for example “Wait 24 hours” or “Pending approval queue”.
Labeling tip: Always include the duration or trigger, such as “Wait 2 days” or “Until payment received”.
Tiny example: Process → Delay → Process
In addition to the core symbols above, many diagrams use extended flowchart symbols to represent documents, data storage, subprocesses, and delays in more complex workflows.
The core symbols above cover most standard diagrams. If you need more operational or industry-specific notation, see process flow chart symbols.
Ready to create your own flowchart? ConceptDraw DIAGRAM includes standard flowchart symbol libraries, ready-to-use templates, and export options for business and technical documentation. See our flowchart software guide or browse flowchart templates in Solution Park.
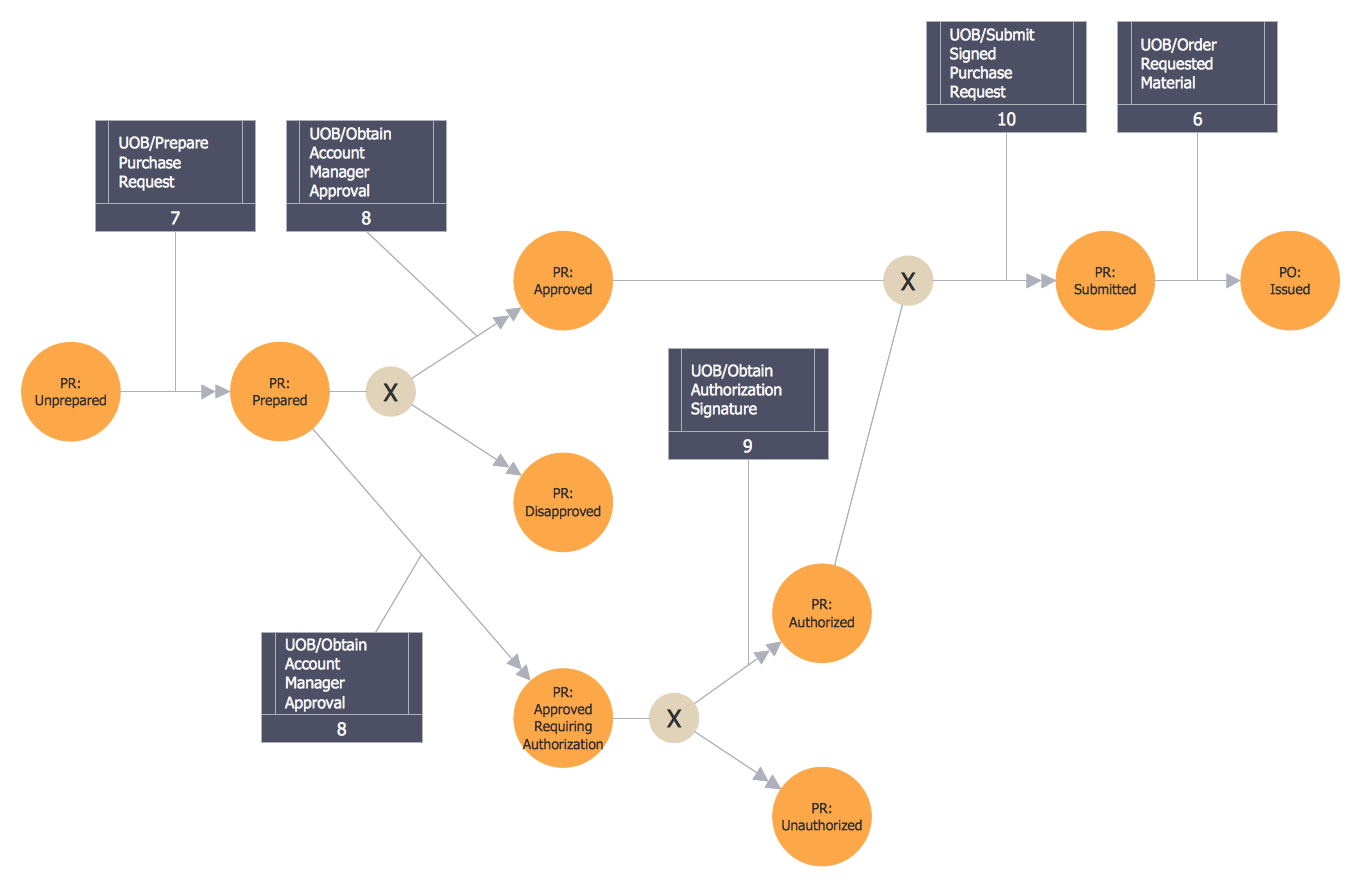
Example Flowchart: Customer Request Approval Process Using Standard Symbols
After reviewing the individual symbols, the example below shows how they work together in a simple business process.

This example shows how individual standard symbols work together to describe a complete process from input to decision and outcome.
This example shows how the most common symbols work together to represent a simple process. The cheat sheet below summarizes their meaning and their most typical use in process diagrams.
Flowchart Symbols Cheat Sheet
The table below provides a quick-reference summary of the most common flowchart symbols, their meaning, and when to use them in real-world process diagrams.
| Symbol | Meaning | When to Use | Common Mistake |
|---|---|---|---|
| Start / End | Marks the beginning or completion of a process. | Use at process boundaries. | Using it for normal steps. |
| Process | Represents a task or action. | For each operational step. | Writing long sentences inside shapes. |
| Decision | Represents a conditional branch. | When the flow splits into labeled outcomes. | Not labeling outgoing arrows. |
| Input / Output | Data entering or leaving the process. | Forms, reports, system output, or user input. | Using it for processing actions. |
| Connector | Links distant parts of the diagram. | Large diagrams or multi-page flows. | Overusing connectors instead of simplifying the flow. |
| Document | A document or report used or produced in the process. | When creating, reviewing, sending, or storing documents. | Using it for generic steps instead of actual documents. |
| Database / Data Store | Stored data the process reads from or writes to. | When saving, retrieving, or persisting records. | Confusing data storage with processing actions. |
| Predefined Process | A referenced subprocess that expands into another diagram. | When a step represents a reusable procedure. | Using it without a clear reference to details. |
| Delay | A waiting period before the next step. | When time-based holds or queues matter. | Not specifying duration or trigger. |
The cheat sheet above summarizes symbol meaning in a compact reference format. The next section turns that reference into a faster decision tool so you can choose the right flowchart symbol based on a specific diagram task.
Quick Selection Guide
Which symbol should I use? Use this quick reference to choose common symbols faster.
| If you need to… | Use this symbol | Why |
|---|---|---|
| Show the beginning or end of a process | Start / End (Terminator) | Defines the boundaries of the flow. |
| Describe an action or task | Process (Rectangle) | Represents a single step. |
| Route the flow based on a condition | Decision (Diamond) | Creates labeled branches such as Yes/No. |
| Show data entering or leaving a process | Input / Output (Parallelogram) | Separates data exchange from actions. |
| Connect distant parts of the same page | Connector (On-page) | Avoids long or crossing lines. |
| Continue the flow on another page or screen | Off-page Connector | References continuation across pages. |
If you are documenting business processes, auditing workflows, or preparing technical diagrams, using standardized flowchart shapes improves clarity, consistency, and readability.
Common Mistakes and Best Practices
- Use one symbol per meaning; avoid mixing multiple semantics in one shape.
- Label decision outcomes consistently, such as Yes/No or True/False.
- Keep flow direction consistent, usually top-down or left-to-right.
- Avoid crossing lines; use connectors as diagrams grow.
- Prefer core symbols unless advanced notation is truly necessary.
- Use swimlanes when ownership or responsibility must be shown.
- If you use non-standard symbols, define them in a legend.
If ownership matters, use cross-functional flowcharts to show roles and handoffs clearly.
Standards and Notation
This section explains why most diagrams rely on a stable standard symbol set even when different tools and teams use slightly different visual styling.
Flowchart notation has evolved through decades of engineering and business practice, and its core symbols remain widely recognized across industries. In practice, most flowcharts rely on a stable set of standard symbols such as process, decision, input/output, and connectors to preserve consistent interpretation.
Most modern flowchart symbols originate from standards developed by the American National Standards Institute (ANSI) and later recognized internationally by the International Organization for Standardization (ISO). One of the best-known references is ISO 5807, which defines documentation symbols and conventions for system and process flowcharts. While not every diagram strictly follows these specifications today, the core symbol set remains broadly consistent with these conventions. That is why best practices matter: they help readers interpret diagrams quickly even when styling varies from one tool or team to another.
Standard vs Non-standard Flowchart Symbols
In practice, most professional diagrams rely on the small core set of standardized symbols described earlier on this page.
Standard symbols are recommended when your diagram must be understood by a broad audience. Non-standard symbols can work for internal conventions, but they should be introduced with a legend to reduce ambiguity and misinterpretation.
In professional environments, consistent use of standard flowchart symbols improves cross-team communication and supports clearer process documentation.
Micro-Comparison: Flowchart vs Workflow Diagram vs Process Map
These standard symbols are most useful when you understand the type of diagram you are creating. The comparison below shows where flowcharts fit relative to workflow diagrams and process maps.
| Feature | Flowchart | Workflow Diagram | Process Map |
|---|---|---|---|
| Main Focus | Decision logic and control flow | Task movement and handoffs | High-level process structure |
| Primary Use | Algorithm and process modeling | Operational coordination | Strategic overview |
| Typical Complexity | Medium to high | Medium | Low to medium |
The comparison above clarifies when a flowchart is the appropriate diagram type. Once that is established, the next step is understanding the most common structural patterns used to organize flowchart logic.
Common Flowchart Structures
In addition to understanding what each flowchart symbol means, it is useful to recognize the most common structural patterns used in flowcharts. These patterns describe how symbols are arranged to represent logic and control flow.
| Structure | Description |
|---|---|
| Sequence | A linear series of steps performed one after another. This is the most common and simplest flow structure. |
| Decision (Conditional) | A branching structure based on a condition such as Yes/No or True/False, typically represented using the decision symbol. |
| Loop | A repeated sequence of steps that continues until a specific condition is met. |
| Case | A multi-branch structure where one of several possible paths is selected based on defined conditions. |
These structural patterns are built using standard symbols such as process, decision, and connectors. Once the structure is clear, the next practical question is which tool or template to use to build and share the diagram efficiently.
Tools and Templates
Once you understand the meaning of standard flowchart symbols, the next step is applying them consistently in a diagramming tool. Create professional diagrams using ConceptDraw DIAGRAM. The software includes professionally designed flowchart symbol libraries, drag-and-drop templates, and export options for business documentation.
If you plan to build diagrams regularly, compare options in our flowchart software guide.
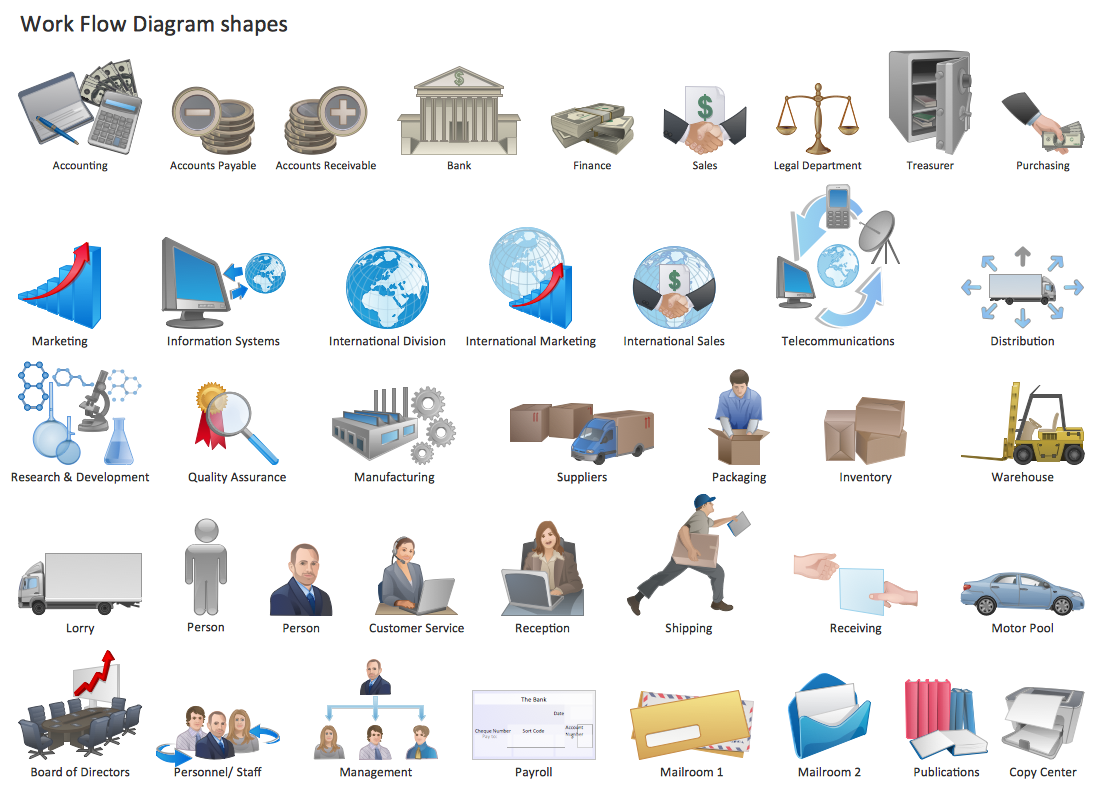
It is used for operational modeling, technical process visualization, and structured business documentation. Explore additional diagram collections and symbol libraries in the Flowchart Solutions section.
Built-in Flowchart Symbol Library
The Flowcharts Rapid Draw library in ConceptDraw DIAGRAM provides a complete set of standard flowchart symbols, including process, decision, input/output, connectors, and swimlanes.
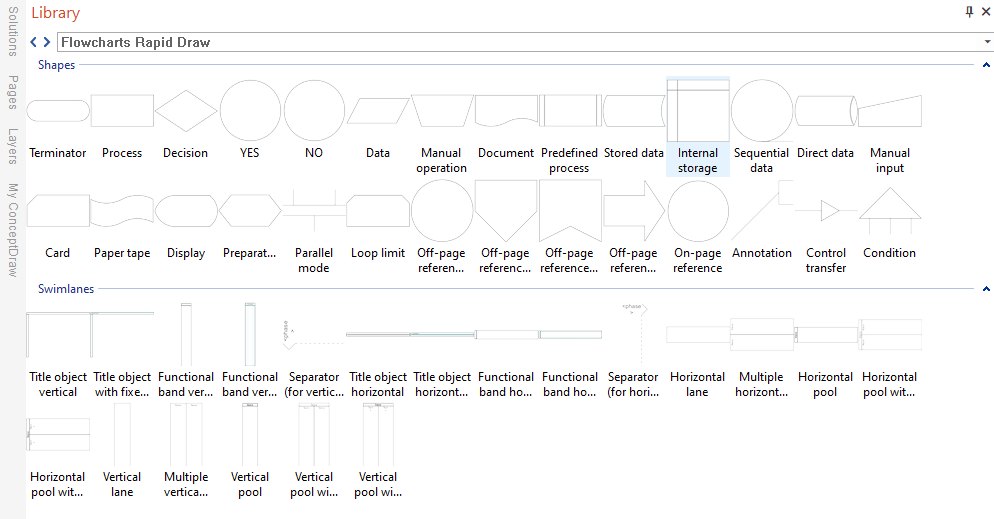
This visual shows how standard flowchart symbols are organized inside the drawing environment for faster diagram creation.
Specialized Symbol Sets
These are extensions / libraries; not all are part of ANSI/ISO flowchart symbols.
BPMN/IDEF are separate notations; use when you need formal business-process semantics.
See also alternative and industry-specific symbol libraries and diagram sets:
Workflow Chart Symbols
Workflow diagrams describe work completed by different departments in a fixed sequence. These symbols help visualize tasks, handoffs, and responsibilities across teams.
This diagram shows how workflow-specific symbols extend basic flowchart notation when ownership and task movement matter.
See also: Workflow diagram guide.
Process Map Symbols
Process map symbols help represent business process structure with more emphasis on visibility, performance, and optimization.
This visual explains how process maps use related symbol sets to show structure and improvement opportunities across a process chain.
See also: Process mapping guide.
Audit Flowchart Symbols
Audit flowchart symbols are adapted for compliance workflows, financial tracking, and structured quality documentation.
This diagram illustrates how audit-oriented symbols support controlled documentation of reviews, checks, and compliance steps.
See also: Audit flowchart guide.
HR Flowchart Symbols
HR flowchart symbols help map recruitment, hiring, onboarding, payroll, and employee development processes.
This visual shows how HR teams can use specialized symbols to document people-related workflows more clearly.
See also: HR flowchart guide.
Formal Business Process Notations
Some teams move beyond general-purpose flowcharts and use formal notations when they need stricter semantics and enterprise-level process modeling conventions.
Business Process Diagram Symbols (BPMN)
BPMN is designed to create diagrams that are understandable to business stakeholders while supporting more formal business-process semantics than a basic flowchart.
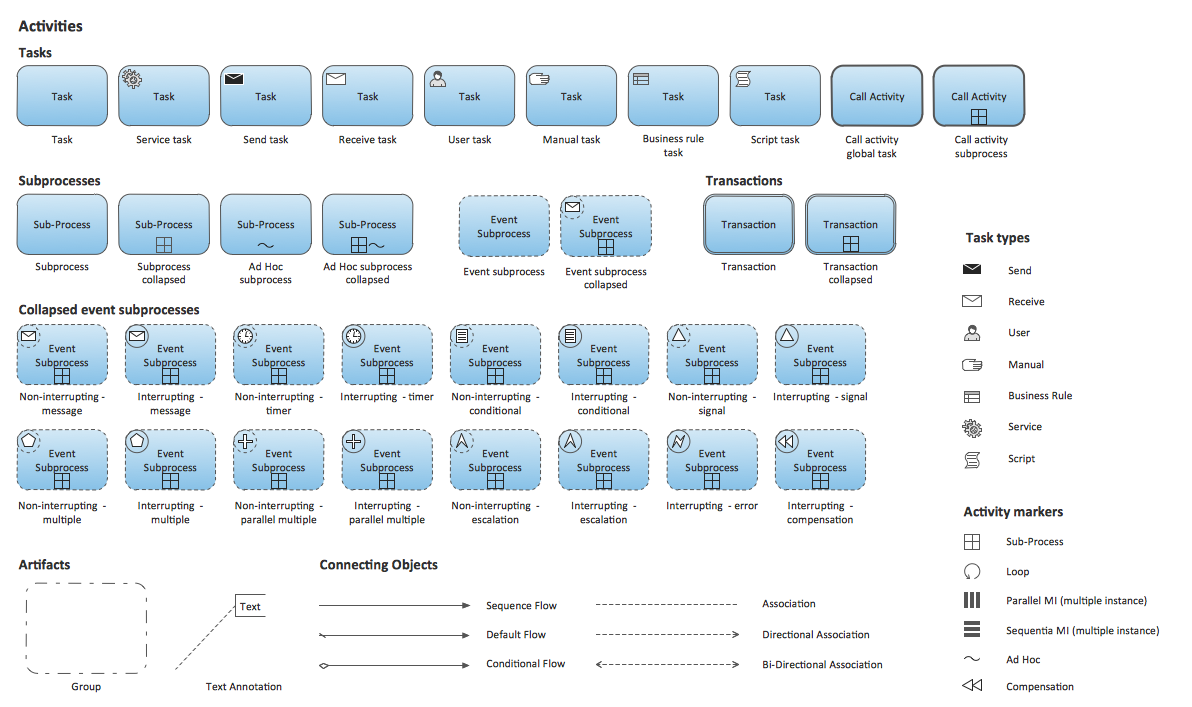
This diagram helps readers distinguish general-purpose flowchart symbols from BPMN notation used in formal process modeling.
See also: BPMN diagram guide.
IDEF0 Diagram Symbols
IDEF0 diagrams visualize functional system models and are used in systems analysis, integration, and structured business process modeling.
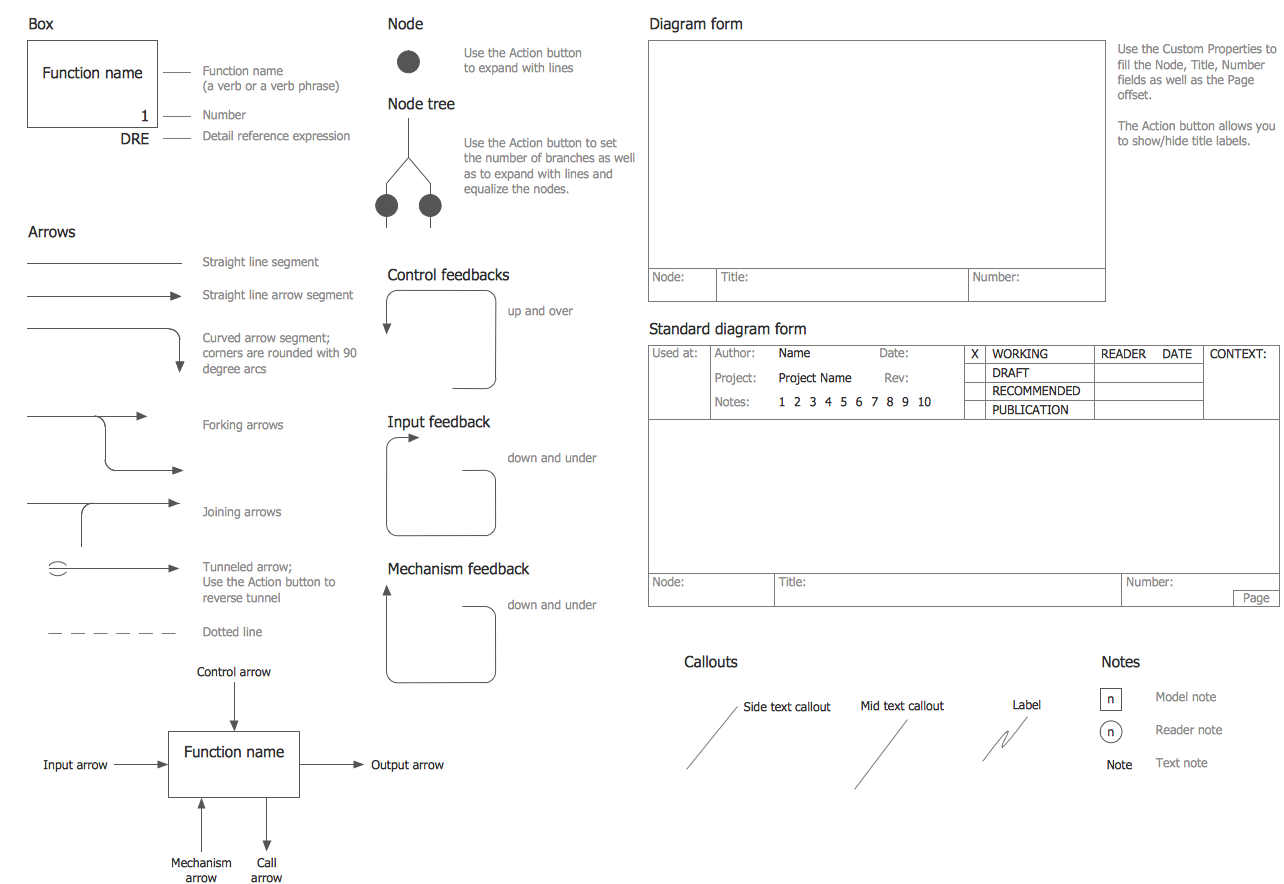
This visual shows how IDEF0 uses a more formal symbolic system for modeling functions, inputs, controls, outputs, and mechanisms.
See also: IDEF diagram guide.
After reviewing standard, specialized, and formal symbol systems, the next practical step is determining how the diagram will be shared, presented, or exported in real workflows.
Export and Formats
Once the right symbols and related notation are selected, the next practical step is choosing how the finished flowchart will be shared, presented, or exported.
Flowcharts created in ConceptDraw DIAGRAM can be reviewed, modified, and converted into multiple formats:
| # | Variety of Formats |
|---|---|
| 1. | MS Visio |
| 2. | HTML |
| 3. | PDF file |
| 4. | MS PowerPoint Presentation |
| 5. | SVG |
| 6. | Image |
Once the diagram is created and prepared for sharing, the related resources below provide deeper guidance on flowchart structure, examples, design, and software selection.
Related Flowchart Resources in This Cluster
- Flowchart guide — overview of flowchart concepts, structure, and common use cases.
- Process flow chart symbols — process-specific symbol reference for operational diagrams.
- Flowchart examples — real process diagrams showing how flowcharts work in practice.
- Flowchart design — layout, readability, and diagram design principles.
- Flowchart software — tools for creating, editing, and sharing professional diagrams.
If you still have practical questions after the reference sections above, the FAQ below addresses the points that come up most often when applying standard symbols, understanding their meaning, and using them in real diagrams.
FAQ
What do flowchart symbols mean?
The meaning of flowchart symbols refers to the standardized interpretation of shapes used in process diagrams. Each shape represents a specific function, such as a process step, a decision point, or data input/output.
What shapes are used in flowcharts?
Most flowcharts use a core set of standard shapes: Start/End (terminator), Process (rectangle), Decision (diamond), Input/Output (parallelogram), and connectors or flowlines for navigation and direction.
What are the 5 basic flowchart symbols?
The most common symbols are Start/End (terminator), Process, Decision, Input/Output, and Flowlines (arrows) that show sequence.
What symbol is used for a decision in a flowchart?
A decision is typically shown as a diamond with labeled outgoing branches such as Yes/No or True/False.
What is the difference between a connector and an off-page connector?
An on-page connector links parts of the same diagram on one page. An off-page connector indicates that the flow continues on another page or screen.
What are standard flowchart symbols?
Standard flowchart symbols follow widely used conventions so diagrams remain readable across teams and industries.
Can I invent my own flowchart symbols?
You can, but it is best to keep a consistent, recognizable set of symbols. If you use custom symbols, include a legend that explains them.
How do I label decision branches?
Use short labels such as Yes/No or True/False directly on the outgoing arrows and keep them consistent.
Do I need swimlanes for roles or departments?
Use swimlanes or cross-functional flowcharts when responsibility matters. Lanes show who performs each step and where decisions are owned.
Flowchart symbols vs BPMN symbols — what is the difference?
Flowcharts use a small general-purpose symbol set, while BPMN is a more formal notation designed for business process semantics.
What does a parallelogram mean in a flowchart?
In a flowchart, a parallelogram represents input or output. It is used to show data entering the process, such as user input, or information leaving the process, such as a report or displayed result.