Business Process Flowchart
ConceptDraw DIAGRAM
ConceptDraw DIAGRAM is a business process flowchart software. This software includes the basic package of business process flowchart examples.

Example 1. Business process flowchart solution
The software delivers built-in object libraries with vector stencils that allows you to use RapidDraw technology. Clicking on direction arrows you can add a new object to the flowchart.

Example 2. Business process flowchart symbols library
Cross-functional (deployment) flowcharts visualize what functional units (people, departments or functional areas) are responsible for the business process operations.
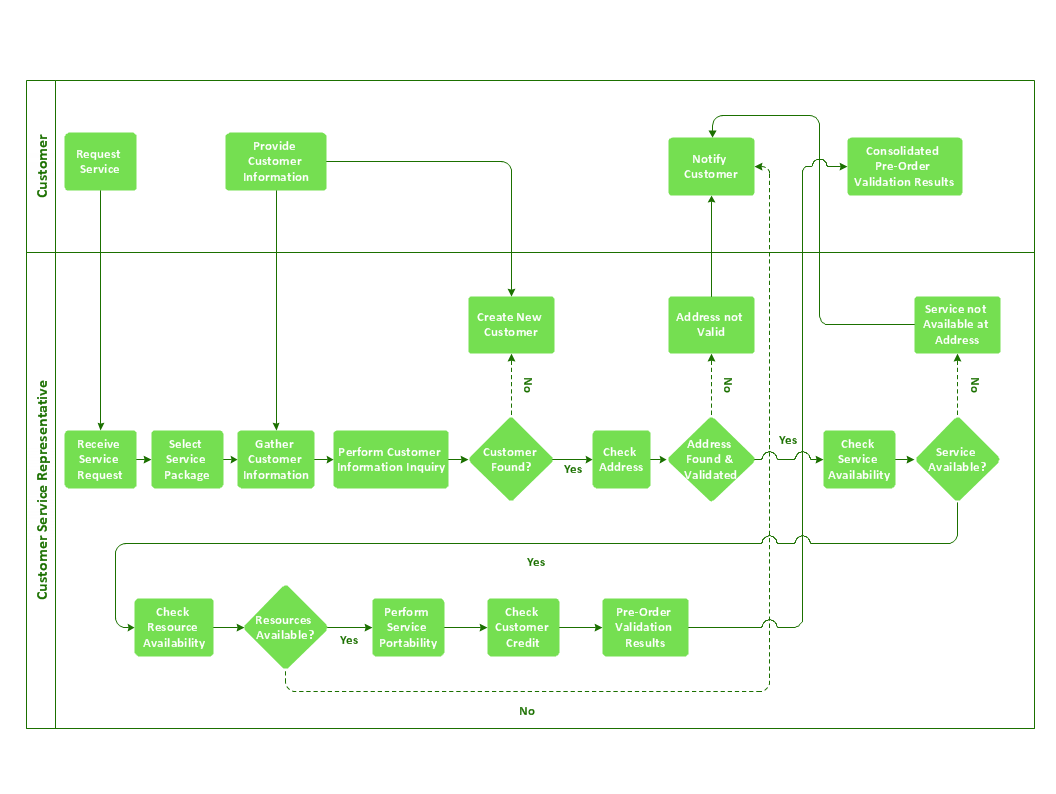
Example 3. Business Process Flowchart : Providing telecom services.
The flowcharts are divided into rows/columns of functional units. Blocks of various shapes represent the process steps, and are placed in rows/columns of the responsible functional units.
These flowcharts are used to display the relationships of processes and responsible functional units.
TEN RELATED HOW TO's:
This mind map demonstrates how the well-known Total Quality Management (TQM) methodology can be presented in a mind map. Using mind mapping for quality management is a creative approach that allows one to structure all key quality points on the one page.
Picture: Total Quality Management
Related Solution:
ConceptDraw DIAGRAM extended with IDEF Business Process Diagrams solution from the Business Processes area of ConceptDraw Solution Park is an ideal software for effective database design and drawing IDEF diagrams visually representing all steps of database design process.
Picture: Database Design
Related Solution:
Plumbing systems are very important for any manufacture, and it's a good practice to have a clear scheme of that system. To create one, you should use a piping and instrumentation diagram software with a possibility to save files in vector format, so you can print them without quality loss. ConceptDraw DIAGRAM is a great tool for creating diagrams, and you don't need to be very experienced to use it efficiently.
This example of Piping and Instrumentation Diagram (P&ID) depicts a scheme that illustrates the physical sequence and functional communications of piping, instrumentation and plumbing equipment components of a typical food trailer.
Seeking to avoid health troubles in a mobile food service , the plumbing demands for food trailers must be considered accurately. This P&ID shows all of piping including a basic set of piping system components along with multiple sinks, extra water heaters and other elements to meet health guidelines.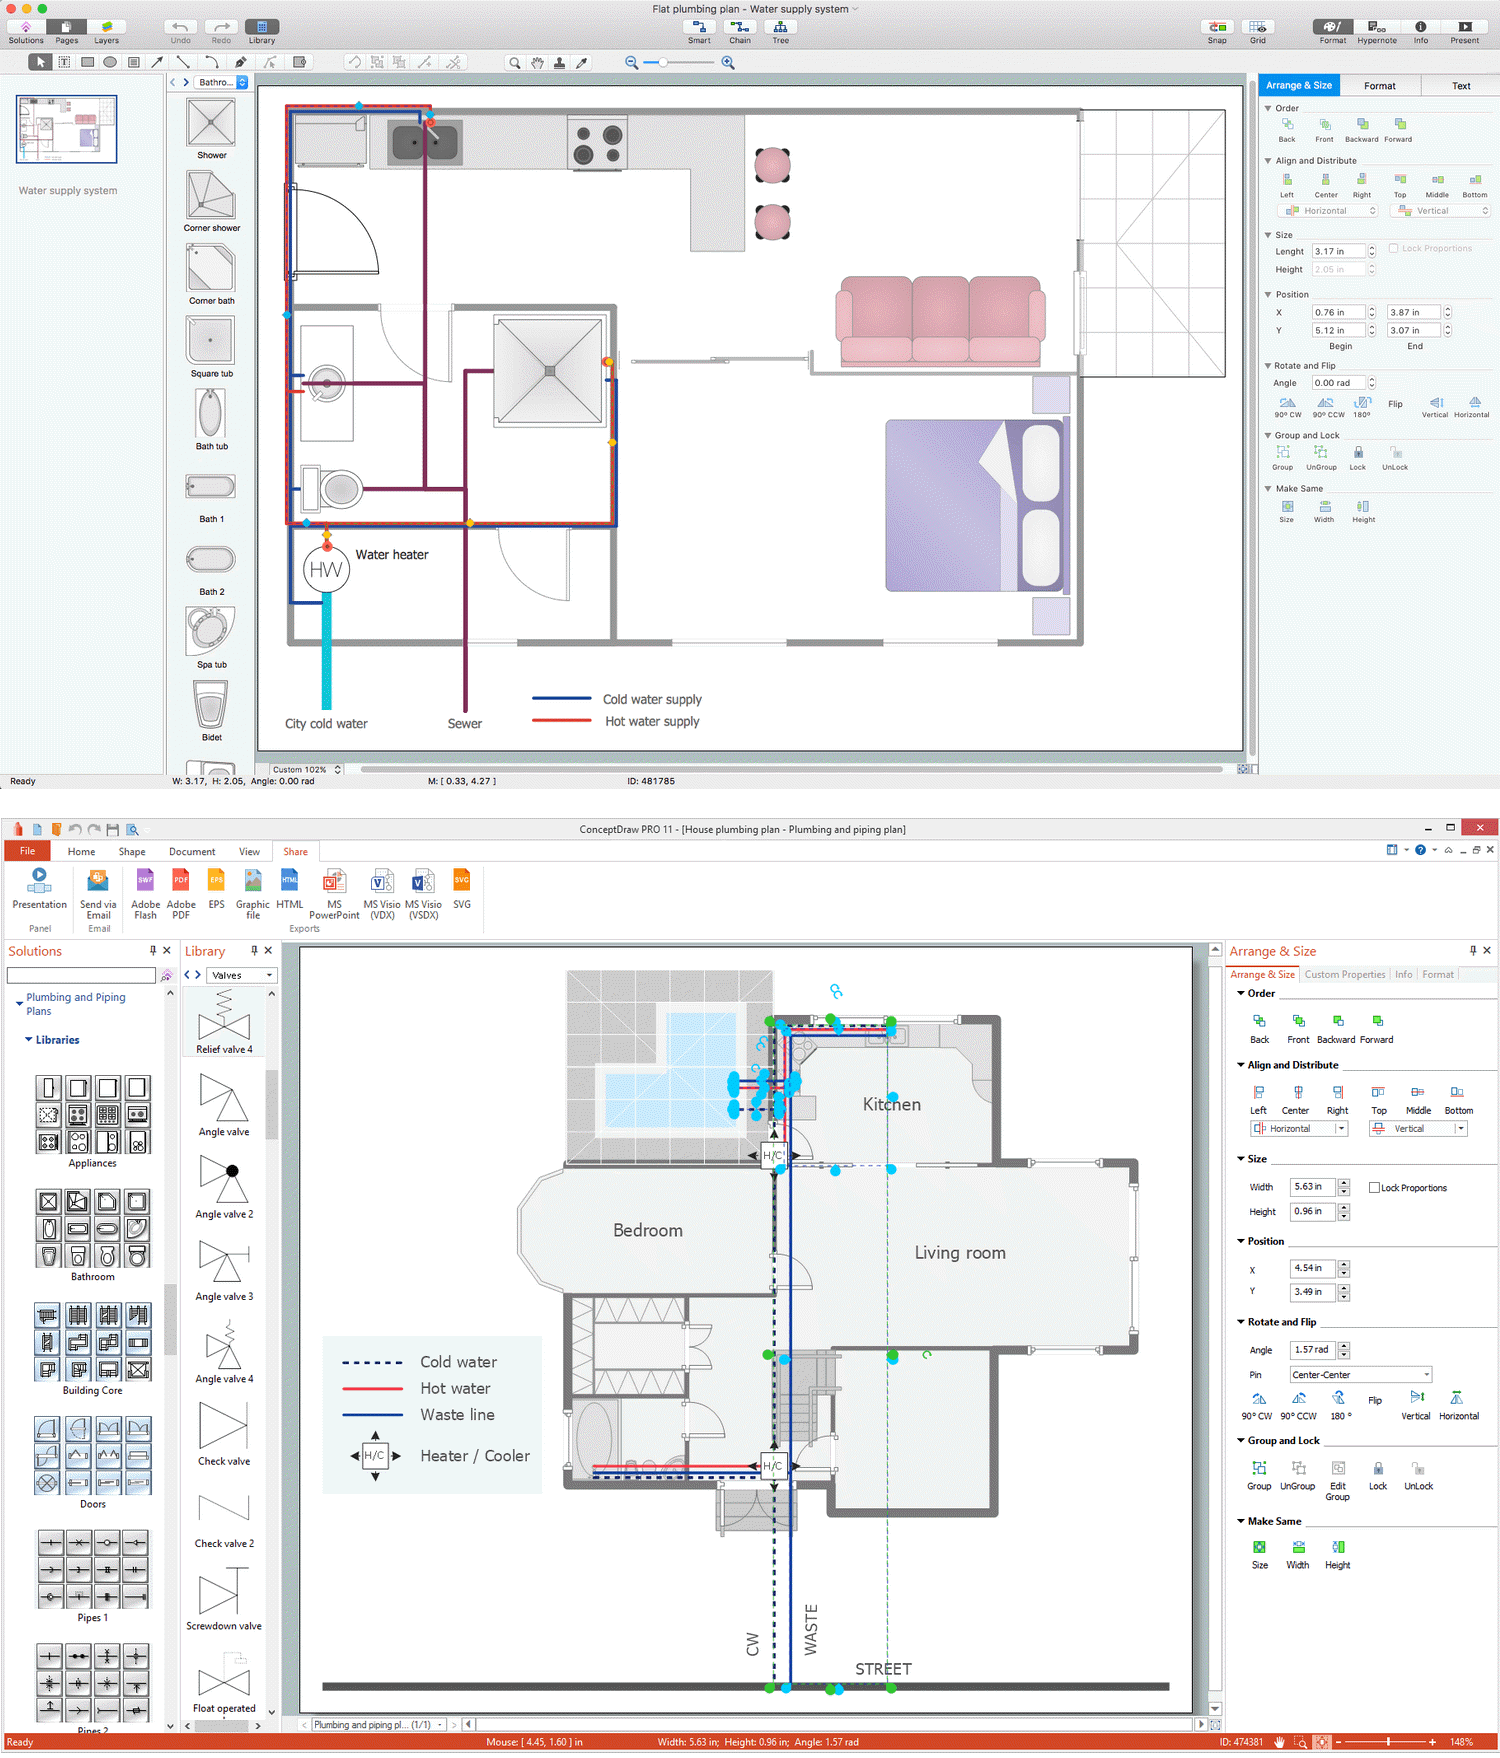
Picture: Piping and Instrumentation Diagram Software
Related Solution:
First of all, Saudi Arabia is known as the Land of the Two Holy Mosques. Two of the holiest sites of Islam are located in Saudi Arabia. Medina - the city where the Quran was finally approved, and where Prophet Muhammad was buried, and Mecca, the birthplace of Muhammad. Every year, millions of muslims perform hajj and visit Al-Masjid al-Haram - the Sacred Mosque. Unfortunately, the entry is prohibited for non-Muslim people. The citizens of the country live under Sharia law, which impose certain obligations. For example, the usage of drugs and alcohol is forbidden. Gambling is also under the ban. Expats have a possibility to live in special reservations - compounds, where some concessions are allowed, for example, the appearance of women is not so strictly regulated and they have a right to drive there.
Picture: Geo Map - Asia - Saudi Arabia
Related Solution:
To draw a good diagram of a business workflow you should have a ready-to-use set of pre-designed objects you may drag-and-drop to your document focusing on the workflow structure and meaning, not drawing tools. ConceptDraw DIAGRAM with Workflow Diagrams solution provides complete set of design element you may use to draw a good diagram of a business workflow.
Picture: How to Draw a Good Diagram of a Business Workflow?
Related Solution:
To support you in your tasks you can use the power of ConceptDraw DIAGRAM providing intelligent vector graphics that are useful for Business Process diagramming and ConceptDraw MINDMAP for key Business Process mind maps.
Picture: Business Process
Related Solution:
Create flowcharts, org charts, shipping flowcharts, floor plans, business diagrams and more with ConceptDraw. Includes 1000s of professional-looking business templates that you can modify and make your own.
Picture: Basic Diagramming
Related Solution:
Drawing an electric circuit plan with all the wiring might seem very complex. If you ever felt afraid to ask how to use electrical and telecom plan software, then it’s time to actually start from altering the templates from the Solution Park. You won’t even notice the moment when you would become an experienced user.
This electrical and telecommunication floor plan plan presents electrical and telecommunication devices located in a country house floor plan. Each electrical or telecom device on this plan is indicated with the particular symbol. Using standard Electrical and Telecommunication symbols makes this floor plan clear for anybody who will be involved into construction process. All the electrical and telecom symbols used in the current floor plan are placed to a legend. This electrical and telecom floor plan can be included as a separate piece into a package of building documentation.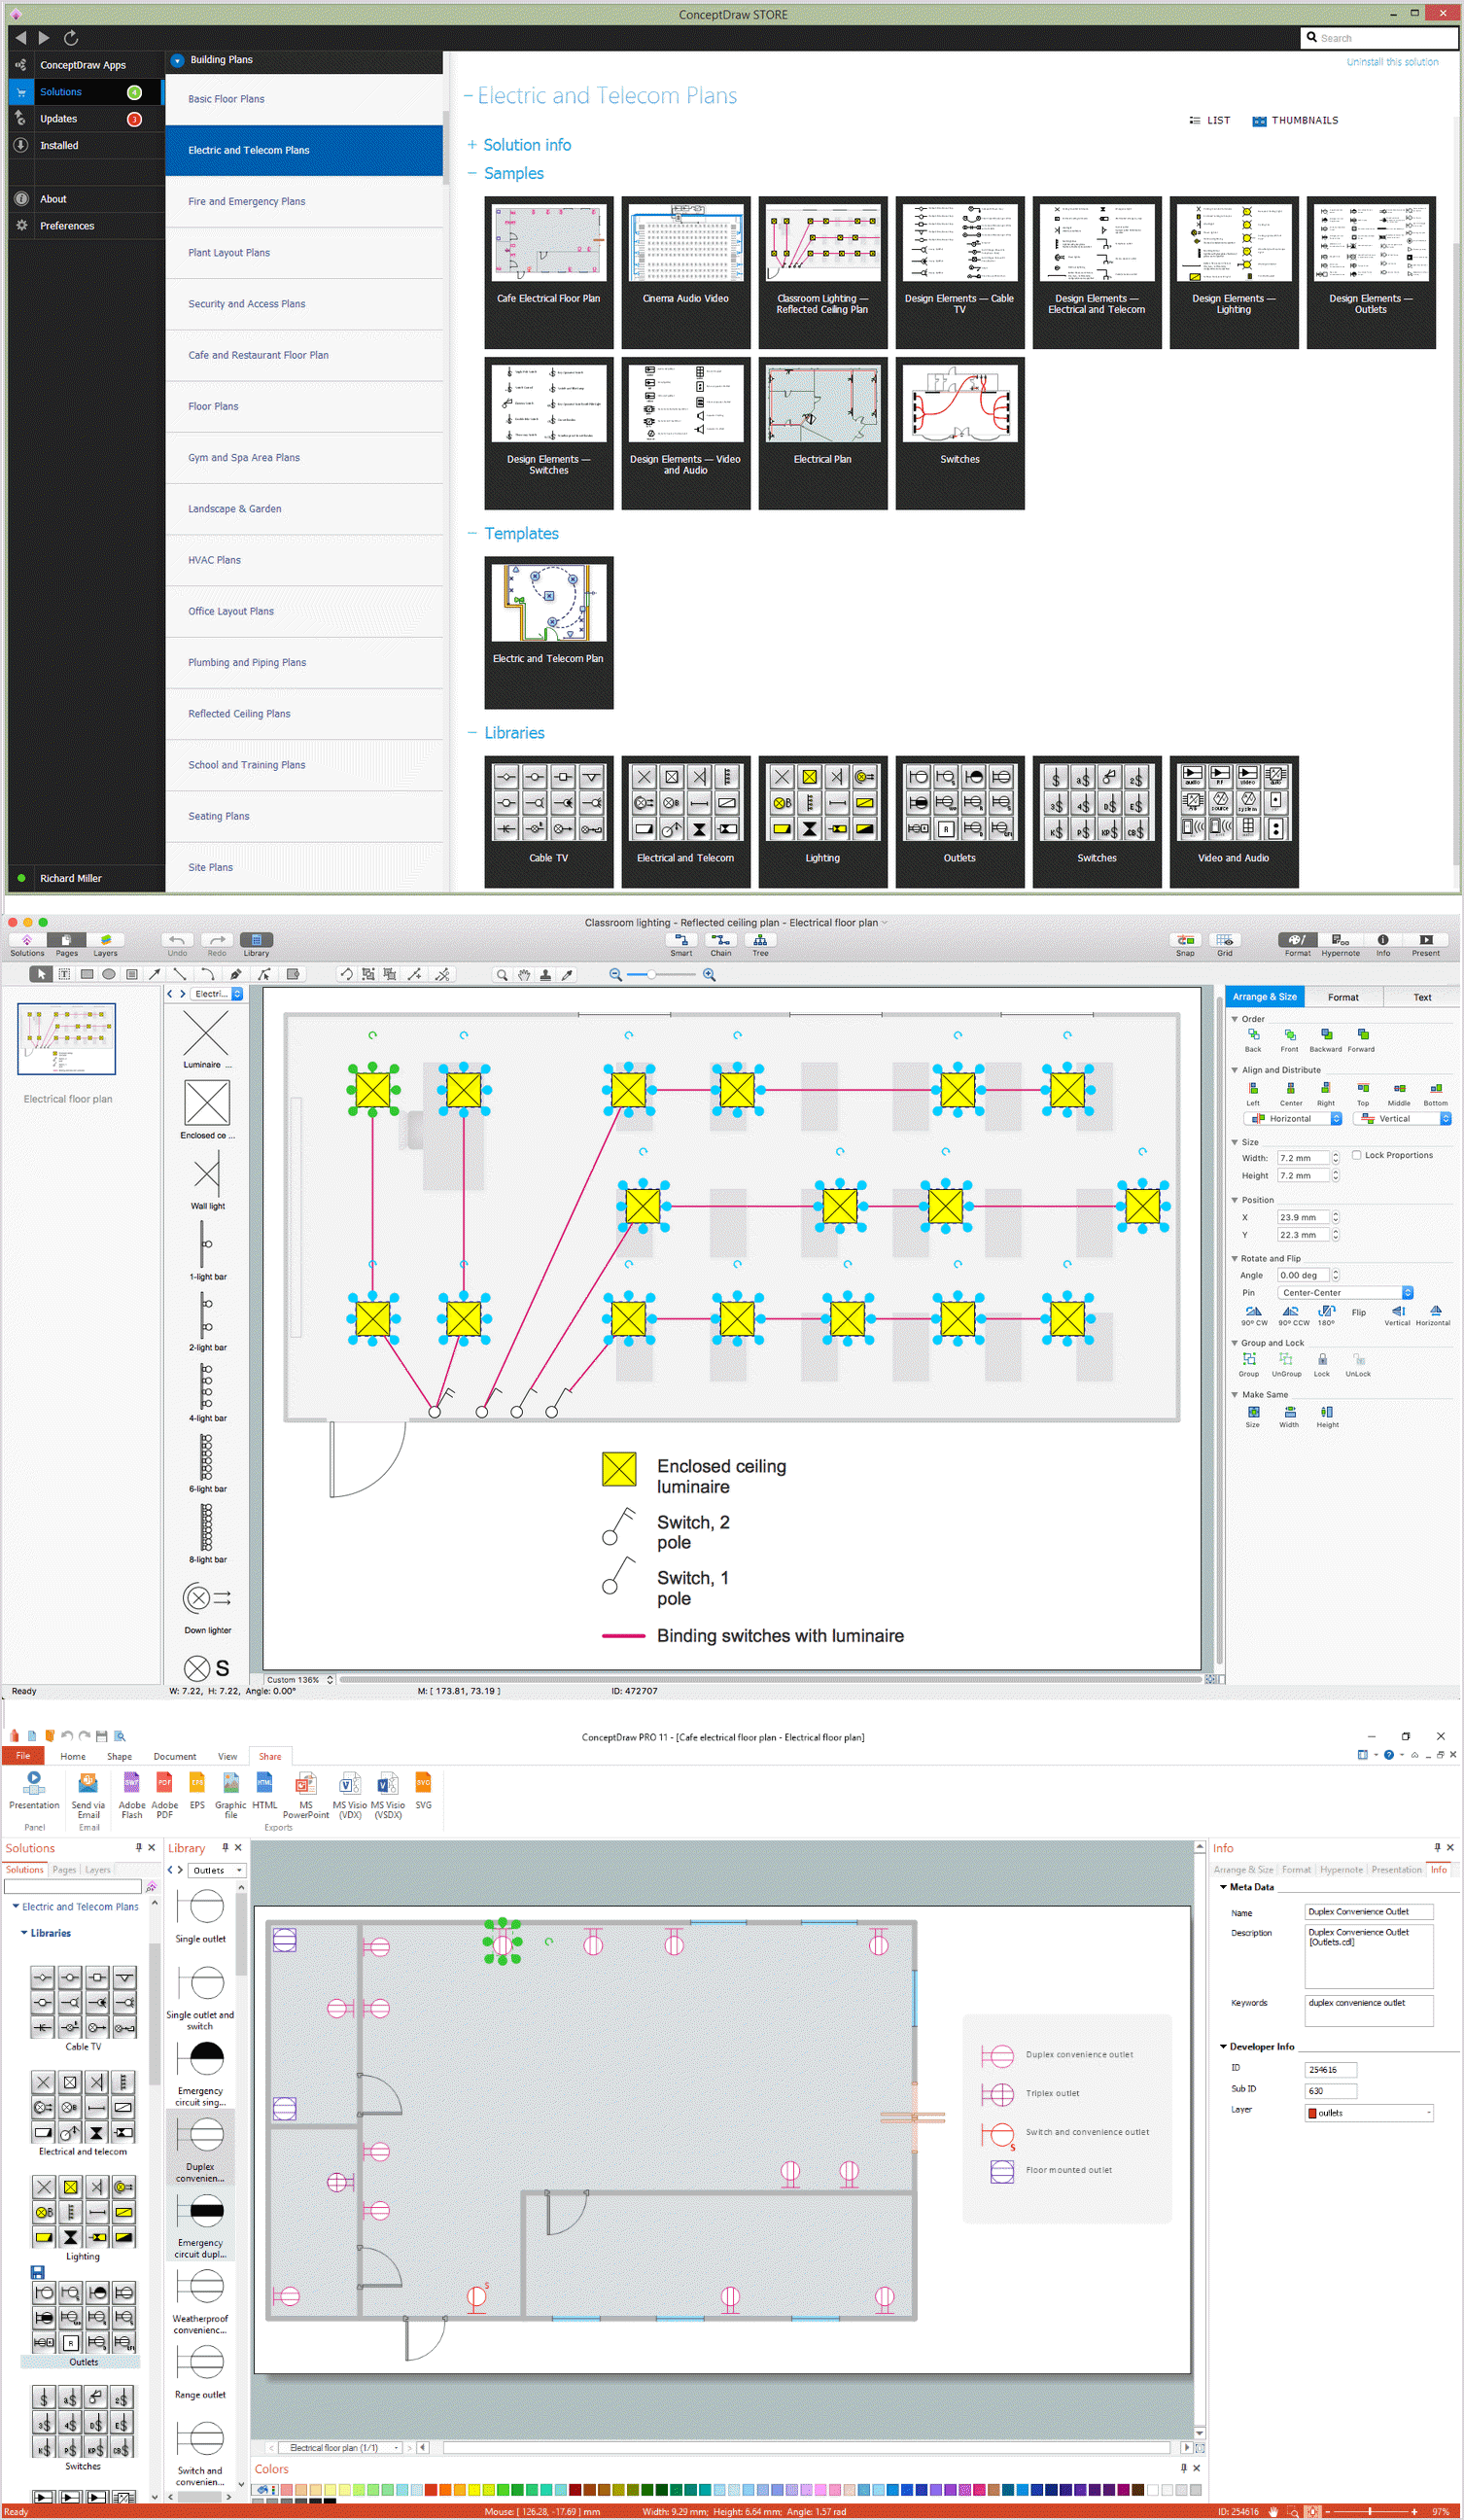
Picture: How To use Electrical and Telecom Plan Software
Related Solution:
How to draw Telecommunications Network Diagram quick, easy and effective? ConceptDraw DIAGRAM offers the unique Telecommunication Network Diagrams Solution from the Computer and Networks Area which will help you.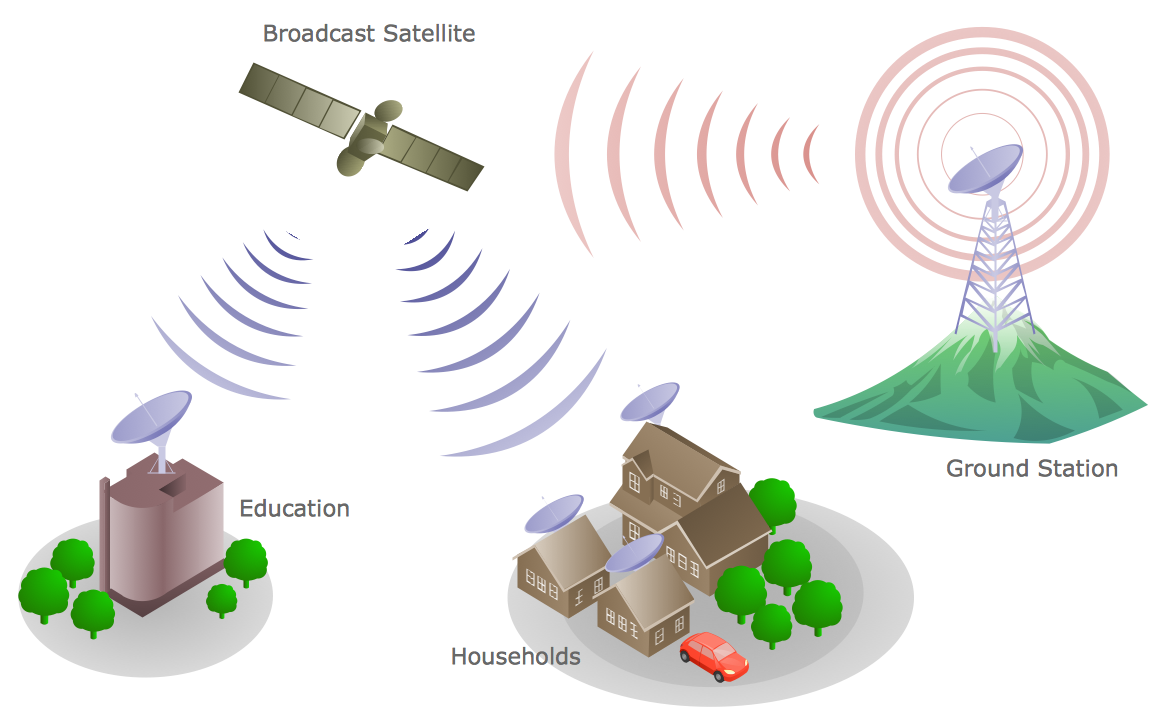
Picture: Telecommunications Network
Related Solution:
Internet solutions on ConceptDraw base. What may interest developers of Internet solutions.
Picture: Software development with ConceptDraw products

