Circle Diagrams
The Circle Diagrams are the diagrams which represent the central element surrounded by other items in a circle. This type of diagram is very popular and widely used in marketing and management, for process modeling, market, resource, time and cost analysis, for visualization causes and effects.
If you dream to design the Circle Diagrams quick and easy – the ConceptDraw DIAGRAM software extended with Business Diagrams Solution from the Management Area is exactly what you need.

Example 1. Circle Diagrams - Diagram Leadership and Data
Business Diagrams Solution was specially designed to give you the opportunity to create professional-looking Circle Diagrams in minutes. Simply create new document and drag the desired object from the Circle-Spoke Diagrams library, type the text to the circles, and your successful and attractive diagram will be ready.

Example 2. Circle-Spoke Diagrams Library Design Elements
Pay attention to the colors, they have a great importance and help you to make your Circle-Spoke and Circle Diagrams more interesting, more successful, more attractive to the audience at the presentations, conferences, in publications. You can set the accents according to your taste, for example you can highlight the main item.

Example 3. Circle Diagrams - Social Determinants of Health
The samples you see on this page were created in ConceptDraw DIAGRAM using the Business Diagrams Solution for ConceptDraw DIAGRAM. These Circle Diagrams successfully demonstrate solution's capabilities and professional results you can achieve. An experienced user spent 5 minutes creating every of these samples.
Use the Business Diagrams Solution for ConceptDraw DIAGRAM software to create your own professional-looking Circle Diagrams of any complexity quick, easy and effective, and then successfully use them in your work or education activity.
All source documents are vector graphic documents. They are available for reviewing, modifying, or converting to a variety of formats (PDF file, MS PowerPoint, MS Visio, and many other graphic formats) from the ConceptDraw STORE. The Business Diagrams Solution is available for all ConceptDraw DIAGRAM or later users.
TEN RELATED HOW TO's:
Social media is a popular view of mass communication which allows people, companies and organizations create, share, discover, modify, access, comment, discuss and exchange information through the Internet. Social Media Response solution for ConceptDraw DIAGRAM provides collection of 10 libraries with diversity of predesigned vector social media flowchart symbols for fast and easy creating interactive Social Media Flowcharts, Response Charts and Action Mind Maps.
Picture: Social Media Flowchart Symbols
Related Solution:
Sometimes it's difficult to find a path in work processes or to understand the requirements, especially when you are a newcomer. To get your thoughts straight, create a workflow diagram, and put everything on it. This will not only help you to get into the workflow, but also show it’s weaknesses.
This illustration captures the workflow process of payment an invoice for the electricity consumed by certain enterprise. It was drawn in ConceptDraw DIAGRAM using its solution for Workflow Diagrams. Making a workflow charts means that you need to depict consistently all processes engaged to the workflow process. Then, you should connect them with symbols meaning study and analysis. Next, add symbols of decisions. A work flow diagram made precisely and correctly can help to clarify your work flow to any person.
Picture: Workflow Diagram
Related Solution:
Digital Learning Tools & Technologies. Online training with Skype for effective classrooms. Changing perceptions of leadership and learning.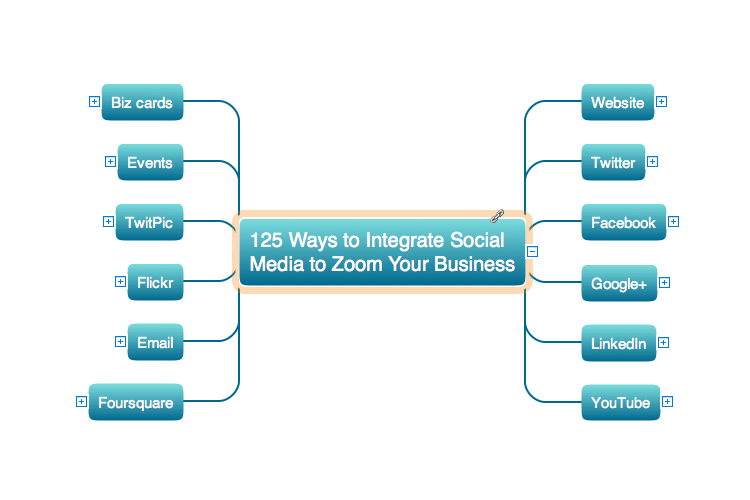
Picture: eLearning for Leadership
Related Solution:
Example of Organizational Chart - Lots of organization chart examples created by ConceptDraw Organizational Chart Software. Include company organizational chart, hospital organizational chart, hotel Organizational chart, corporate organizational chart samples etc
Picture: Example of Organizational Chart
Related Solution:
Process Flow Charts are very popular and widely used in chemical and process engineering for representation a general flow of plant processes and equipment. If you need often draw them, the ConceptDraw DIAGRAM diagramming and vector drawing software extended with tools of Flowcharts Solution will be useful for you.
The mostly used set of process flow chart symbols includes the following: Rectangle (box) process flow chart symbol, Rounded rectangle, Circle, Diamond.
Picture: Process Flow Chart Symbol
Related Solution:
To visualize the relationships between subsets of the universal set you can use Venn diagrams. Сreate your own professional-looking Venn Diagrams quick and easy.
Picture:
Multi Layer Venn Diagram
Venn Diagram Example
Related Solution:
This sample was created in ConceptDraw DIAGRAM diagramming and vector drawing software using the Pie Charts Solution from Graphs and Charts area of ConceptDraw Solution Park.
This sample shows the Pie Chart of the approximate air composition. You can see the percentage of oxygen, nitrogen and other gases in the air visualized on this Pie Chart.
Picture: Percentage Pie Chart. Pie Chart Examples
Related Solution:

