Basic Circles Venn Diagram
Venn Diagram Example
Venn's construction for 2 sets
This template shows the Venn Diagram. It was created in ConceptDraw DIAGRAM software using the ready-to-use objects from the Business Diagrams Solution from the Management area of ConceptDraw Solution Park.
Venn Diagrams visualize all possible logical relations between several sets and are widely used in mathematics, logic, statistics, marketing, sociology, etc.
This Venn Diagram shows the relative complement of the set A with respect to the set B. It is the set of the elements in B, but not in A. In other words it is the set-theoretic difference B-A.

Example 1. Basic Circles Venn Diagram.
Using the Business Diagrams Solution for ConceptDraw DIAGRAM you can create your own professional-looking Venn Diagrams quick and easy.
The Venn Diagrams produced with ConceptDraw DIAGRAM are vector graphic documents and are available for reviewing, modifying, and converting to a variety of formats (image, HTML, PDF file, MS PowerPoint Presentation, Adobe Flash or MS Visio).
TEN RELATED HOW TO's:
Create bar graphs for visualizing economics problem solving and financial data comparison using the ConceptDraw DIAGRAM diagramming and vector drawing software extended with the Bar Graphs Solution from the Graphs and Charts area of ConceptDraw Solition Park.
Picture: Bar Diagrams for Problem Solving.Create economics and financial bar charts with Bar Graphs Solution
Related Solution:
A pie chart is a circular diagram showing a set of data divided into proportional slices. There are several variations of this chart such as donut chart, exploded pie chart, multi-level pie charts. Although it is not very informative when a ring chart or circle chart has many sections, so choosing a low number of data points is quite important for a useful pie chart.
ConceptDraw DIAGRAM software with Pie Charts solution helps to create pie and donut charts for effective displaying proportions in statistics, business and mass media for composition comparison, i.e. for visualization of part percentage inside one total.
Picture: Pie Chart Software
Related Solution:
The Stakeholder Onion Diagram is a popular and widely used way to view the relationships of stakeholders to a project goal. The Onion Diagram focuses on the project goal, most of other diagram styles focus on the project, stakeholders, and timeline. This difference favorably distinguishes and separates the Onion Diagram from other types of diagrams.
Design fast and easy Stakeholder Onion Diagrams of any complexity in ConceptDraw DIAGRAM diagramming and vector drawing software using the powerful tools of Stakeholder Onion Diagrams Solution from the Management Area of ConceptDraw Solution Park.
Picture: Stakeholder Onion Diagrams
Related Solution:
Easy charting software comes with beautiful chart templates and examples. This makes it easy to create professional charts without prior experience.
Picture: Chart Examples
Related Solutions:
Problems are obstacles and challenges that one should overcome to reach the goal. They are an inseparable part of any business, and the success of an enterprise often depends on ability to solve all problems effectively. The process of problem solving often uses rational approach, helping to find a suitable solution.
Using Fishbone Diagrams for Problem Solving is a productive and illustrative tool to identify the most important factors causing the trouble. ConceptDraw DIAGRAM extended with Fishbone Diagrams solution from the Management area of ConceptDraw Solution Park is a powerful tool for problem solving with Fishbone Ishikawa diagram graphic method.
Picture: Using Fishbone Diagrams for Problem Solving
Related Solution:
Studying informatics demands knowledge in the area of computer networks as well. The most famous world network, Internet, is an example of wide area network (WAN) topology that connects devices spread on any distance. Unlike other smaller networks that are limited to a building or to a campus, WAN is almost limitless.
This WAN (wide area network) diagram was created in ConceptDraw DIAGRAM. It shows a telecommunication network that covers a large geographical area connecting several settlements. This type of networks is commonly used by business and government institutions. Using the WANs enables them quickly communicate information between remote geographical points. To reproduce this network diagram, you will need the means, provided by ConceptDraw Computer and Network Diagrams solution.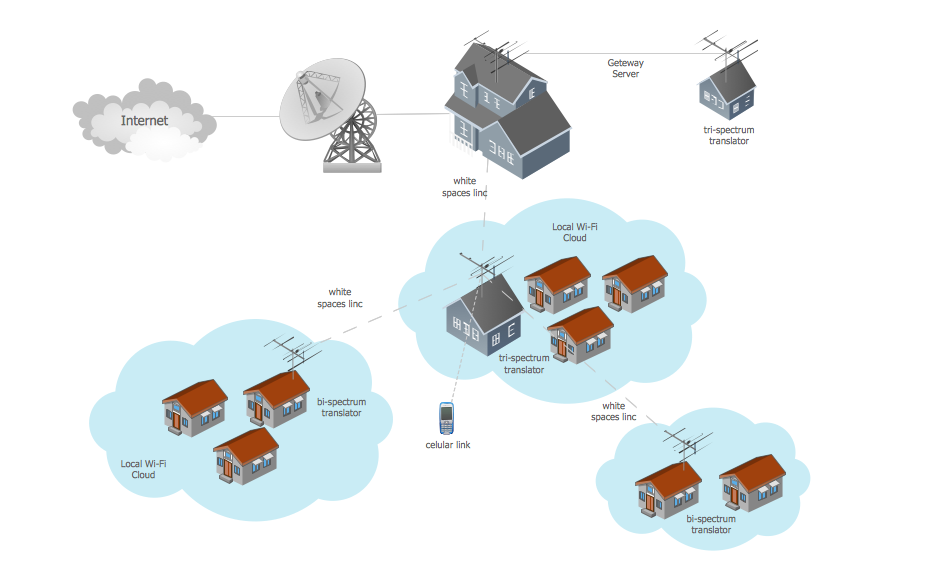
Picture: Wide area network (WAN) topology. Computer and Network Examples
Related Solution:
A list of parameters on which networks differ is very long. A large network with a range up to 50 kilometers is called metropolitan area network (MAN), and this type of network can include several local area networks. Metropolitan networks in their turn connect into global area networks.
Here you will see a Metropolitan Area Network (MAN). This is an extensive network which occupies a large territory including a few buildings or even the whole city. The space of the MAN is bigger than LAN, but lower than WAN. MAN comprise a lot of communication equipment and delivers the Internet connection to the LANs in the city area. Computer and Networks solution for ConceptDraw DIAGRAM provides a set of libraries with ready-to-use vector objects to design various kinds of computer networks.
Picture: Metropolitan area networks (MAN). Computer and Network Examples
Related Solution:
Also included are standardized hr flowchart symbols, meaning your diagrams will be relevant and understood by all business associates.
Picture: HR Flowchart Symbols
Related Solution:
This sample was created in ConceptDraw DIAGRAM diagramming and vector drawing software using the UML Class Diagram library of the Rapid UML Solution from the Software Development area of ConceptDraw Solution Park.
This sample describes the use of the classes, the generalization associations between them, the multiplicity of associations and constraints. Provided UML diagram is one of the examples set that are part of Rapid UML solution.
Picture: UML Class Diagram Generalization ExampleUML Diagrams
Related Solution:
ConceptDraw DIAGRAM is a powerful Venn Diagram maker.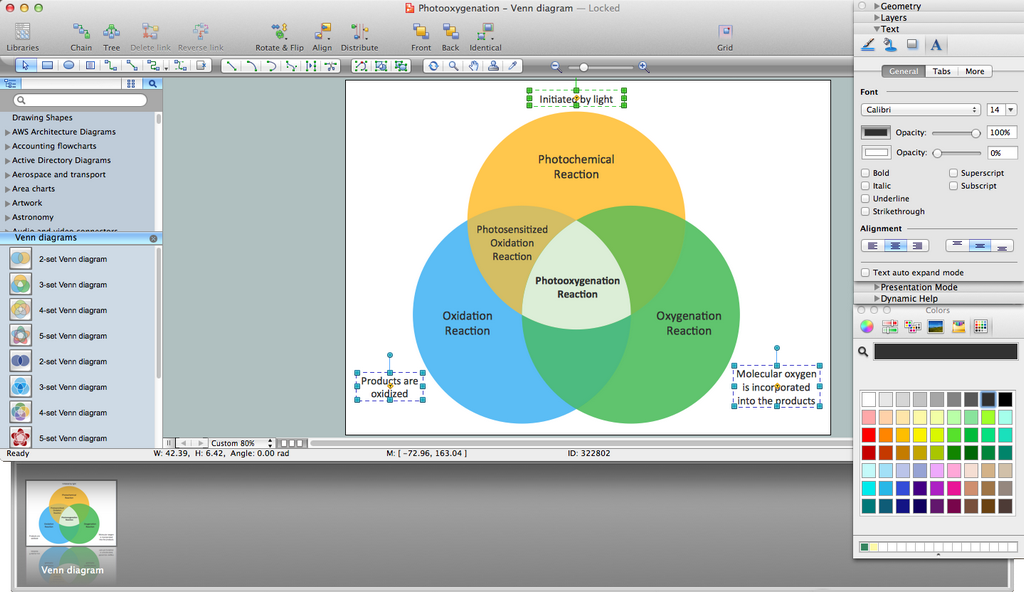
Picture: Venn Diagram Maker
Related Solution: