
Pic. 2. Accounting Information System flowchart
Flowcharts help users of Accounting Information System to understand the step sequences of accounting processes.
Use such professional flowchart maker as ConceptDraw DIAGRAM with Accounting Flowcharts solution to document and communicate visually how accounting processes work, and how each operation is done.

Pic. 3. Accounting Information System solution
All documents are vector graphic documents. They are available for reviewing, modifying or converting to a variety of formats (Bitmap Image, PDF, PowerPoint Presentation or MS Visio).
NINE RELATED HOW TO's:
An orgchart shows how the responsibilities are divided between departments. It’s enough to have just one look on a proper organizational chart template to understand the idea and how it works. To understand how it’s made you should use a diagramming software.
This organizational diagram illustrates the possibilities of using ConceptDraw DIAGRAM to create orgcharts. This sample represents the common project management company. The chart shows the structure of devisions in the company, and the interaction between them. Communication between departments imply a certain structure affiliation and reporting. At the head of the company - President. This diagram was created using ConceptDraw solution for designing Organizational charts of any structure and complexity.
Picture: Organizational Chart Template
Related Solution:
ConceptDraw DIAGRAM extended with Pyramid Diagrams Solution from the Marketing Area of ConceptDraw Solution Park is a powerful Pyramid Charts making software.
A Pyramid Chart has the form of triangle and hierarchically structures, organizes and help to analyze the information, data or ideas. Triangle is divided on the sections that usually have different widths. The width indicates the level of hierarchy among the topics.
Picture: Pyramid Charts
Related Solution:
When thinking about the process of decision making, it's easy to imagine it as a pyramid. We will look at a three level pyramid model as an example. Operational decisions are first that come to mind, and it's the first level. Tactical and strategic decisions are the second and the third levels.
Pyramid (triangle) diagrams are used to show some hierarchical data. Because to the pyramid form of diagram, each diagram slice has a different width. The width of each segment depends on its hierarchical level.
The current image illustrates the model of information system types. Most graphically the model can be represented as a three level pyramid. The first level shows a system of transaction processing It is concentrated on operational tasks. The second level is devoted to tactical solutions of the information system management. And at least, the third level addresses strategy and represents the executive information system. This three level pyramid sample is supplied with the ConceptDraw Pyramid Diagrams solution from Marketing area of ConceptDraw Solution Park.
Picture: Pyramid Diagram
Related Solutions:
The most effective and easiest way to design a Flowchart is to use an easy Flowchart software - ConceptDraw DIAGRAM. It is enhanced with the special Flowcharts solution from the Diagrams area of ConceptDraw Solution Park. This software allows designing as simple as complex processes in a moment. And even drawing multiple flowcharts simultaneously on the separate pages of one document or different ones is also possible.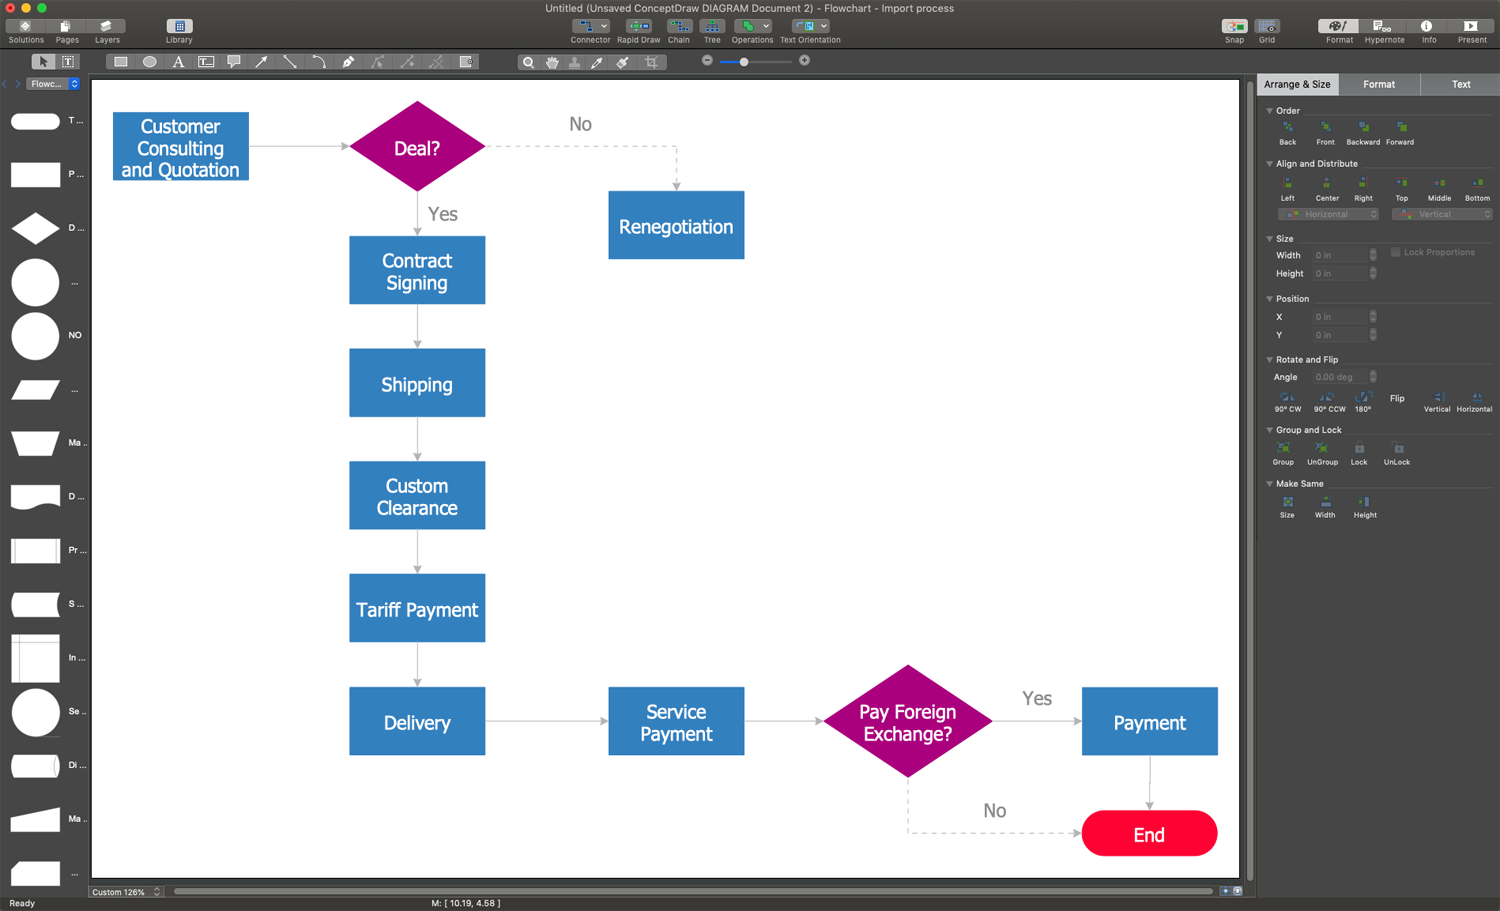
Picture: Easy Flowchart Software
Related Solution:
Risk Diagram (PDPC) - ConceptDraw OFFICE suite is a software for Risks Diagram making. This diagram identifies possible risks in accomplishing corrective actions. With the Risks Diagram, one analyzes each action separately in a tree of all actions and develops a preventive action in response of each potential obstacles or circumstances which may be a risk.
Picture: CORRECTIVE ACTIONS PLANNING. Risk Diagram (PDPC)
If you ever wanted to try any diagramming tools except of Visio, but were afraid to lose existing documents, there’s good news for you. One of the most striking features of ConceptDraw DIAGRAM is it’s perfect compatibility with MS Visio, which guarantees that you won’t depend on operating system anymore, because another ConceptDraw DIAGRAM feature is that it’s cross-platform tool. Don’t waste your time looking for other options, you’ve found the solution already!
Business professionals often utilize the MS Visio as a common tool for making various issues on business visualization. MS Visio is a strong software with good capacity to maintain complex business solutions. But there is no MS Visio for Apple OS X. This is a large invocation, and one would be pleased to recognize that ConceptDraw DIAGRAM is the ideal alternative to MS Visio. Primarily, because this software works natively on both Windows and Apple OS X platforms. if you have migrated from Windows to Mac, or need to communicate in a cross-platform conditions, you’ll search for MS Visio replacer. ConceptDraw DIAGRAM is the exclusive professional business diagramming application that runs on both Windows and Apple OS X. The opportunity exchange files between PC and Mac, as well as between ConceptDraw DIAGRAM and Visio is the significant advantage that permits you to display and to collaborate business information in effortless and cost-effective way.
Picture: ConceptDraw DIAGRAM Compatibility with MS Visio
Use Case Diagrams technology. Using visual graphical objects IDEF1 standard allows to model information interrelations.
Picture: IDEF1 standard
Services UML Diagram. ATM system. This sample was created in ConceptDraw DIAGRAM diagramming and vector drawing software using the UML Use Case Diagram library of the Rapid UML Solution from the Software Development area of ConceptDraw Solution Park.
This sample shows the scheme of the servicing using the ATMs (Automated Teller Machines) and is used at the working of ATM banking systems, at the performing of the banking transactions.
Picture: UML Use Case Diagram Example. Services UML Diagram. ATM system
Related Solution:
Business Process Flow Diagram is one of the main tool of business analysis and business process re-engineering that lets identify and easy understand process flows within organization. Sign up and start today.
Picture: Business Process Flow Diagram
Related Solution:

