Accounting Data Flow from the
Accounting Flowcharts Solution
The Accounting Flowchart visually describes the financial accounting process, shows the accumulated information about transactions and events for creating the balance sheet and the final income statement.
ConceptDraw DIAGRAM provides you the incredibly useful feature — ConceptDraw STORE that gives you the possibility to navigate through ConceptDraw Solution Park, manage downloads and updates, take the access to libraries, templates and samples directly from it.
For designing the Accounting Data Flow from the ConceptDraw STORE you can choose the Accounting Flowcharts Solution from the Finance and Accounting Area.

Sample 1. Accounting Data Flow from the Accounting Flowcharts Solution
Use the predesigned vector objects from the Accounting Flowcharts library creating the Accounting Data Flow from the Accounting Flowcharts Solution.

Sample 2. Accounting Flowcharts Library
To draw the professional looking colorful Accounting Data Flow from the ConceptDraw DIAGRAM quick and easy: simply drag the desired accounting flowchart shapes from the Accounting Flowcharts library into your document, type the title and text, add the colors. You will get the best results in minutes.

Sample 3. Design Elements Accounting Flowcharts
Accounting Flowcharts Solution contains also a wide variety of templates and samples that you can use as the base for your own Accounting Flowcharts of any complexity.

Sample 4. Accounting Data Flow
Use the Accounting Flowcharts Solution to create your own professional Accounting Flowcharts and Accounting Data Flow from the ConceptDraw DIAGRAM quick and easy.
The Accounting Flowcharts produced with ConceptDraw DIAGRAM are vector graphic documents and are available for reviewing, modifying, and converting to a variety of formats (image, HTML, PDF file, MS PowerPoint Presentation, Adobe Flash or MS Visio).
TEN RELATED HOW TO's:
The steps of accounting cycle include the processes of identifying, collecting, analyzing documents, recording transactions, classifying, summarizing, posting, and preparing trial balance, making journal entries, closing the books and final reporting financial information of an organization.
Use the ConceptDraw DIAGRAM with Accounting Flowcharts Solution to create your own professional Accounting Flowcharts of any complexity quick and easy.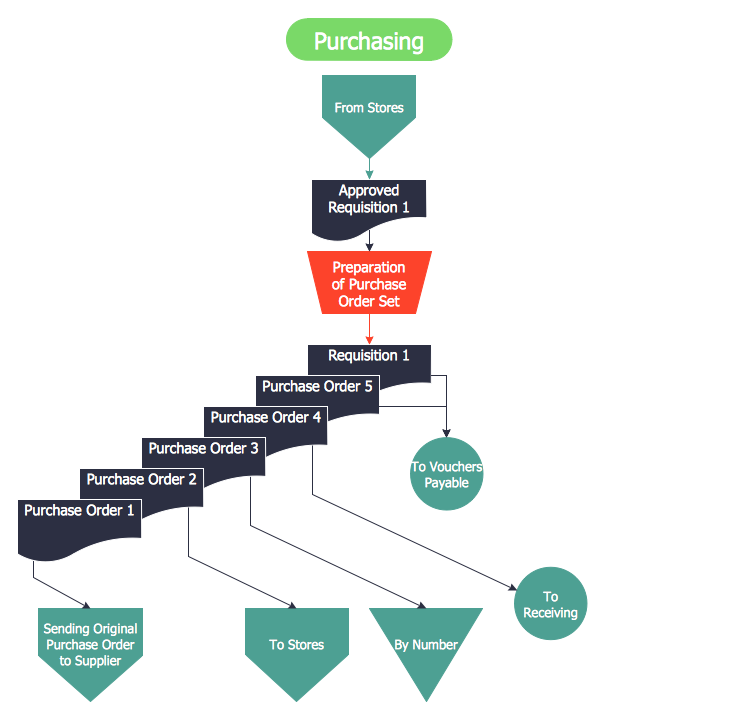
Picture: Steps of Accounting Cycle
Related Solution:
Account Flowchart Stockbridge System
Flowchart Examples →
Once you decide to create a flowchart mentioning all the processes , you can always use well as professionally software — ConceptDraw
Picture:
Account Flowchart Stockbridge System
Flowchart Examples
Related Solution:
ConceptDraw the easy flowchart software that gives users the ability to draw any type of flowcharts. Fast visualization of the structured data with the vector stencils from object libraries by using RapidDraw technology.
Picture: Easy Flowchart Software
Related Solution:
While creating flowcharts and process flow diagrams, you should use special objects to define different statements, so anyone aware of flowcharts can get your scheme right. There is a short and an extended list of basic flowchart symbols and their meaning. Basic flowchart symbols include terminator objects, rectangles for describing steps of a process, diamonds representing appearing conditions and questions and parallelograms to show incoming data.
This diagram gives a general review of the standard symbols that are used when creating flowcharts and process flow diagrams. The practice of using a set of standard flowchart symbols was admitted in order to make flowcharts and other process flow diagrams created by any person properly understandable by other people. The flowchart symbols depict different kinds of actions and phases in a process. The sequence of the actions, and the relationships between them are shown by special lines and arrows. There are a large number of flowchart symbols. Which of them can be used in the particular diagram depends on its type. For instance, some symbols used in data flow diagrams usually are not used in the process flowcharts. Business process system use exactly these flowchart symbols.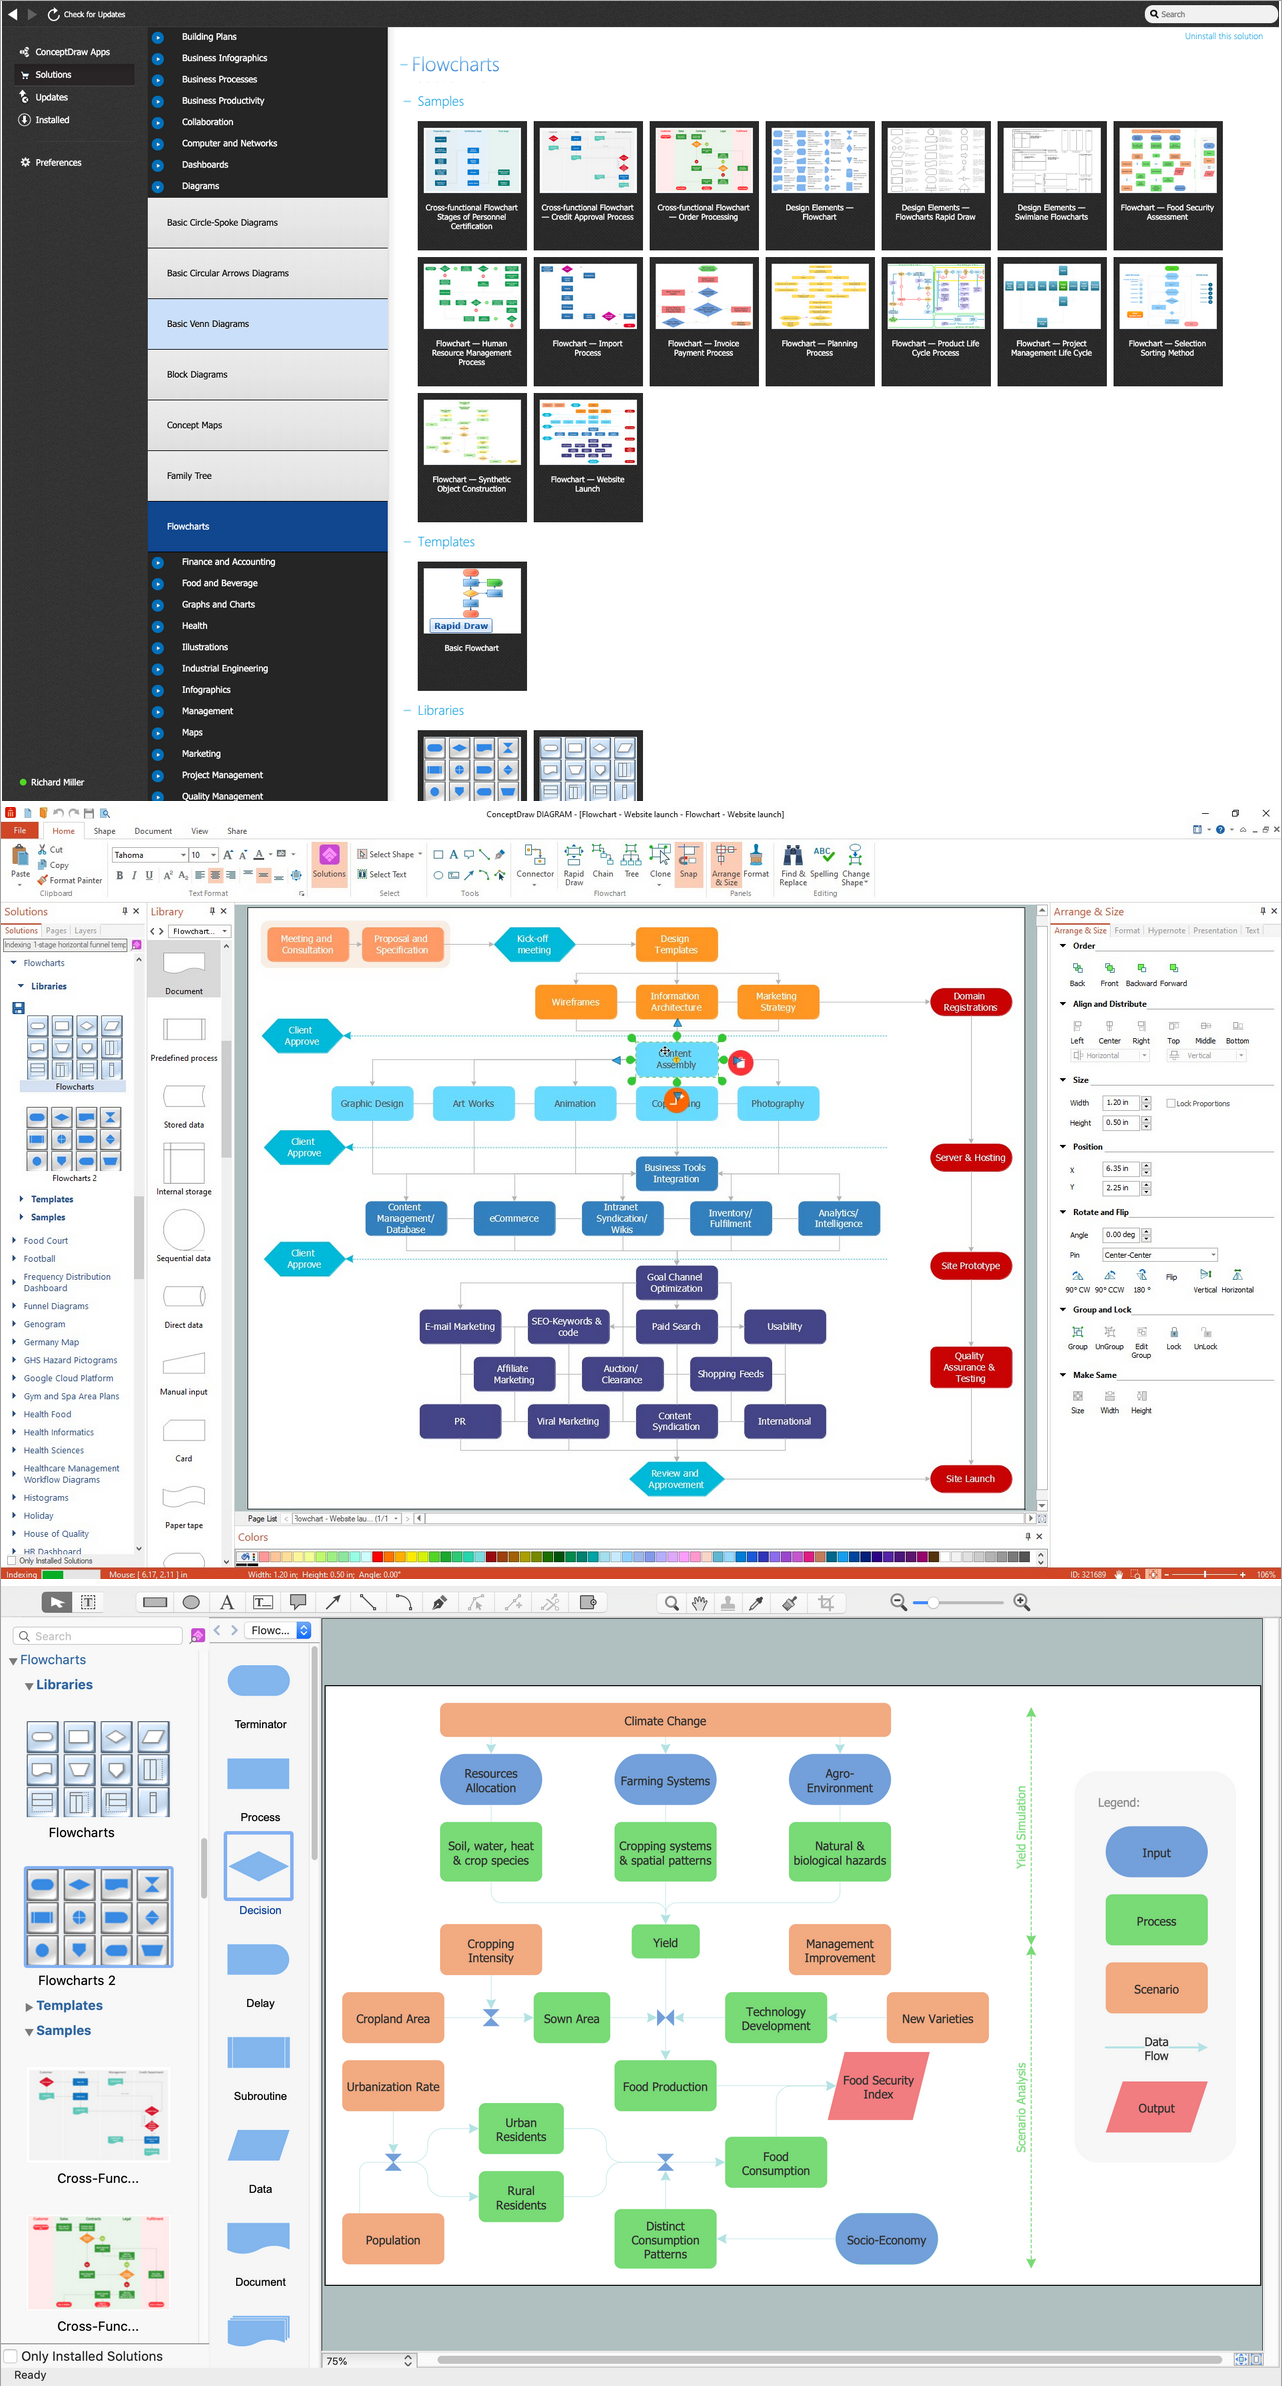
Picture: Basic of Flowchart: Meaning and Symbols
Related Solution:
This sample shows the Pie Donut Chart. It was created in ConceptDraw DIAGRAM diagramming and vector drawing software using the ready-to-use object from the Pie Charts Solution from Graphs and Charts area of ConceptDraw Solution Park.
The Pie Donut Chart visualizes the percentage of parts of the whole and looks like as a ring divided into sectors. Pie Donut Charts are widely used in the business, statistics, analytics, mass media.
Picture: Pie Donut Chart. Pie Chart Examples
Related Solution:
Download ConceptDraw diagram software for easy drawing.
Picture: The Best Choice for Creating Diagram
Related Solution:
To describe the accounting processing use ConceptDraw Flowchart set of symbold created for Accounting data processing.
Tips, Methods and Symbols on How to Create Flowcharts for an Accounting Information System.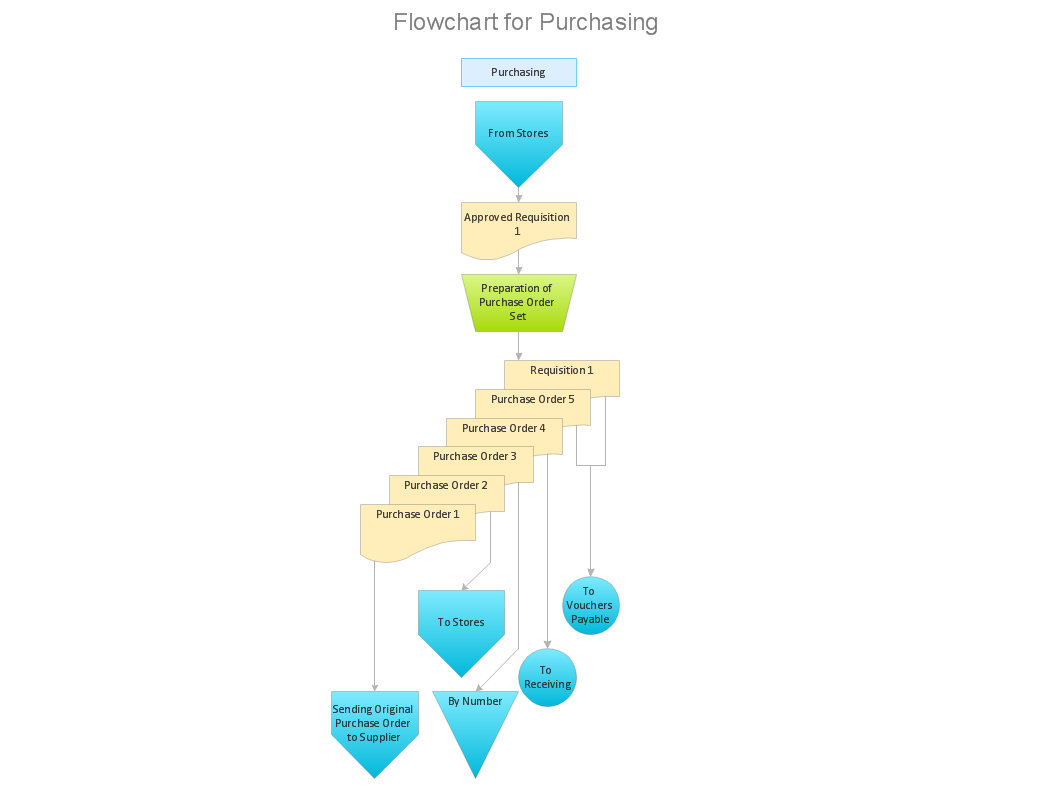
Picture: How Do You Make An Accounting Process Flowchart?
Related Solution:
How to build segregation of duties using drawing tools from Accounting Flowcharts Solution for ConceptDraw DIAGRAM software.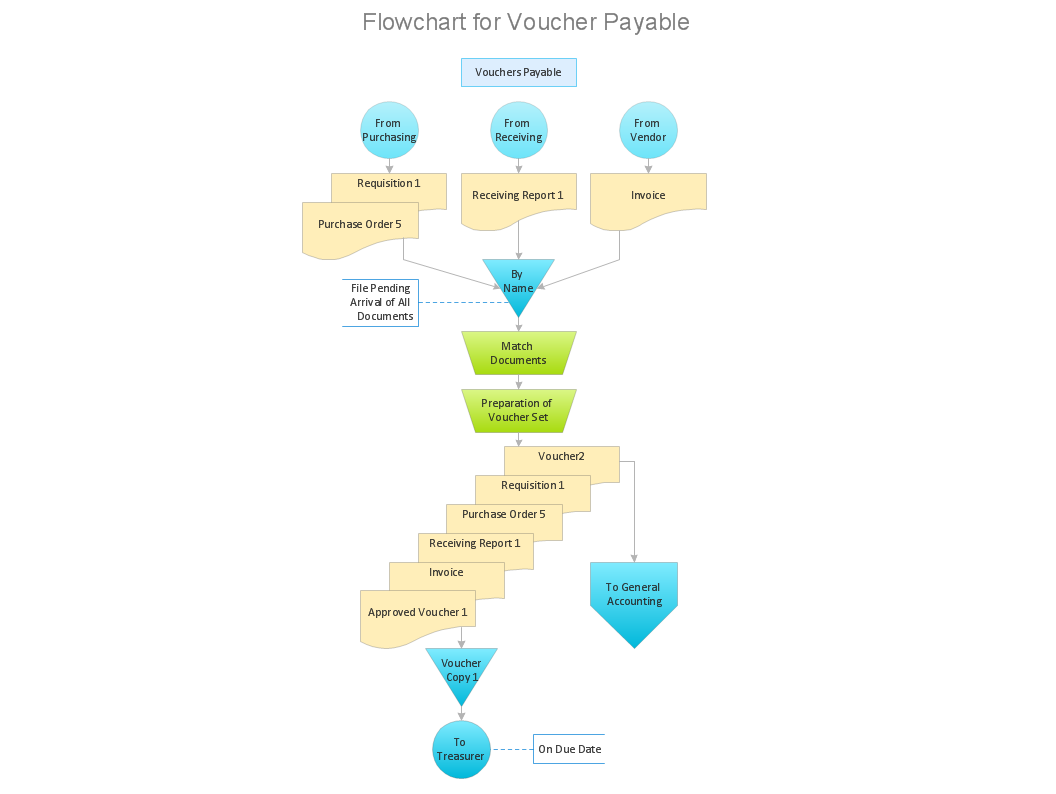
Picture: Approval Process and Segregation of ResponsibilitiesAccounting Flowchart Example
Related Solution:
When studying a business process or system involving the transfer of data, it is common to use a Data Flow Diagram (DFD) to visualize how data are processed. Being initially used exclusively in regards to the flow of data through a computer system, now DFDs are employed as the business modeling tools. They are applied to describe the business events and interactions, or physical systems involving data storage and transfer. ConceptDraw DIAGRAM is a powerful Data Flow Diagram software thanks to the Data Flow Diagrams solution from the Software Development area of ConceptDraw Solution Park.
Picture: Data Flow Diagram Software
Related Solution:
The vector stencils library IDEF0 Diagram from the solution IDEF0 Diagrams contains specific IDEF0 diagram symbols such as arrow symbols and entity symbols for ConceptDraw DIAGRAM diagramming and vector drawing software. The IDEF0 Diagram solution is contained in the Software Development area of ConceptDraw Solution Park.
Picture: IDEF0 Diagram
Related Solution:


