Winter Sports. Olympic Games Infographics. Medal Table

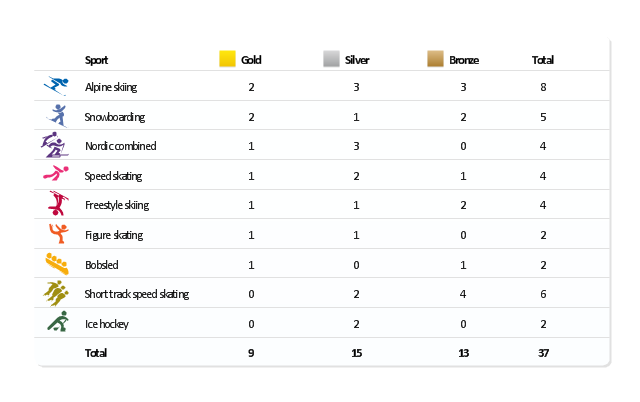
"The United States participated in the 2010 Winter Olympics in Vancouver, British Columbia, Canada. The U.S. team had a historic Winter Games, winning an unprecedented 37 medals. Team USA's medal haul, which included nine gold, marked the first time since the 1932 Lake Placid Games that the U.S. earned more medals than any other participant. ...
The United States finished the 2010 Olympic Games by setting a new record for the most medals won by a single country at a Winter Olympics. The previous record of 36 was set by Germany at the 2002 Winter Olympics; with the silver medal won by the men's hockey team in the final Olympic event of 2010, the U.S. earned their 37th medal of the Vancouver Games. In addition, the U.S. team set a Winter Games record for bronze medals with 13, and the 15 silver medals by the U.S. was second only to the record of 16 set by Germany in 2002." [United States at the 2010 Winter Olympics. Wikipedia]
This medal table example "US at the 2010 Winter Olympics" is created using the ConceptDraw PRO diagramming and vector drawing software extended with the Winter Sports solution.
The Winter Sports solution from the Sport area of ConceptDraw Solution Park contains the vector stencils library "Winter sports pictograms" and examples of diagrams and infographics.
Medal table
Winter Sports Vector Clipart. Medal Map. Spatial Infographics

 Winter Sports
The Winter Sports solution from Sport area of ConceptDraw Solution Park contains winter sports illustration examples, templates and vector clipart libraries.
Winter Sports. Using Winter Sports Design Elements Producing Infographics

Clipart School

Business People Clipart

Winter Sports. Olympic Games Illustrations. Medal Summary

Mind Map Making Software

- Winter Sports. Olympic Games Infographics. Medal Table | Winter ...
- Sochi 2014 Olympics medal count | Winter Sports. Olympic Games ...
- Winter Olympics pictograms - Vector stencils library | Winter Sports ...
- Winter Olympics - Vector stencils library | Winter Sports | Winter ...
- Winter Sports. Olympic Games Illustrations. Medal Summary | Winter ...
- Winter Sports. Olympic Games Infographics. Medal Table | Basic ...
- Flow Chart for Olympic Sports | Winter Sports. Olympic Games ...
- Winter Sports | Winter Sports. Olympic Games Illustrations. Medal ...
- Winter Sports | Winter Sports. Olympic Games Illustrations. Medal ...
- Skeleton - Winter sports pictograms | Medals by sport table - US at ...
- Sochi 2014 Winter Olympics ® - Snowboarding results | Winter ...
- Winter Sports. Illustrations and Visualize Statistics | Winter Sports ...
- Design elements - Tables | Symbol for Pool Table for Floor Plans ...
- Sport pictograms. Olympic Games | Design elements - Winter ...
- Winter Sports Vector Clipart. Medal Map. Spatial Infographics ...
- Winter Sports. Olympic Games Infographics. Medal Table
- Gold Medals in 2010 Winter Olympics - Infographics with winter ...
- Winter Sports. Olympic Games Illustrations. Medal Summary
- Design elements - Winter Olympics pictograms | Winter Olympics ...
- Alpine skiing medals at the 2010 Winter Olympics - Infographics with ...