This site uses cookies. By continuing to browse the ConceptDraw site you are agreeing to our Use of Site Cookies.
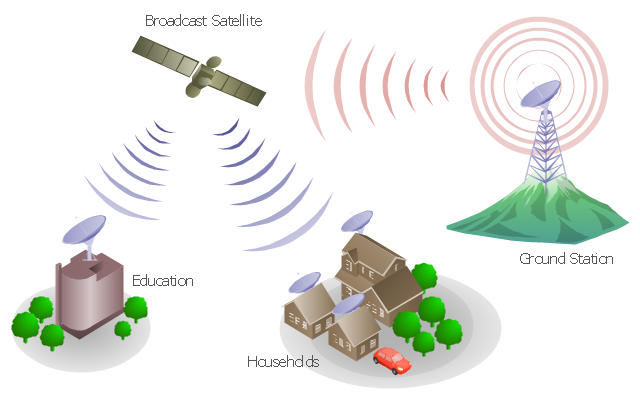
"Media (singular medium) are the storage and transmission channels or tools used to store and deliver information or data. It is often referred to as synonymous with mass media or news media, but may refer to any means of information communication. ...
Analog telecommunications include some radio systems, historical telephony systems, and historical TV broadcasts.
Digital telecommunications allow for computer-mediated communication, telegraphy, and computer networks.
Modern communication media now allow for intense long-distance exchanges between larger numbers of people (many-to-many communication via e-mail, Internet forums, and teleportation). On the other hand, many traditional broadcast media and mass media favor one-to-many communication (television, cinema, radio, newspaper, magazines, and also facebook)." [Media (communication). Wikipedia]
This communication medium diagram example was created using the ConceptDraw PRO diagramming and vector drawing software extended with the Telecommunication Network Diagrams solution from the Computer and Networks area of ConceptDraw Solution Park.
Telecommunication network diagram
Telecommunication network diagram, tree, satellite dish, satellite, radio waves, office building, mountain, house, car,

Basic Diagramming

Perfect charts and graphics diagramming software with rich examples and template. ConceptDraw is ideal to draw Charts and Graphics.

Pie Chart Word Template. Pie Chart Examples

The Pie Chart visualizes the data as the proportional parts of a whole and looks like a disk divided into sectors. The pie chart is type of graph, pie chart looks as circle devided into sectors. Pie Charts are widely used in the business, statistics, analytics, mass media. It’s very effective way of displaying relative sizes of parts, the proportion of the whole thing.

UML Diagram for Mac

This sample was created on the Mac in ConceptDraw DIAGRAM diagramming and vector drawing software using the UML State Machine Diagram library of the Rapid UML Solution from the Software Development area of ConceptDraw Solution Park.

How to Present Workflow to Team

To pull a social media team together, to set your objectives, to develope an integrated communications strategy.

Metropolitan area networks (MAN). Computer and Network Examples

Metropolitan Area Network combines local networks located within a city, and is based on high data rate compounds, implemented on the basis of fiber channels and other digital data transmission channels. Now, with the increasing number of network communities, wireless local area networks based on 802.11b standard are combined into a wireless metropolitan area network consisting of affordable antenna systems and consumer-grade wireless equipment using 802.11a and 802.11b standards.

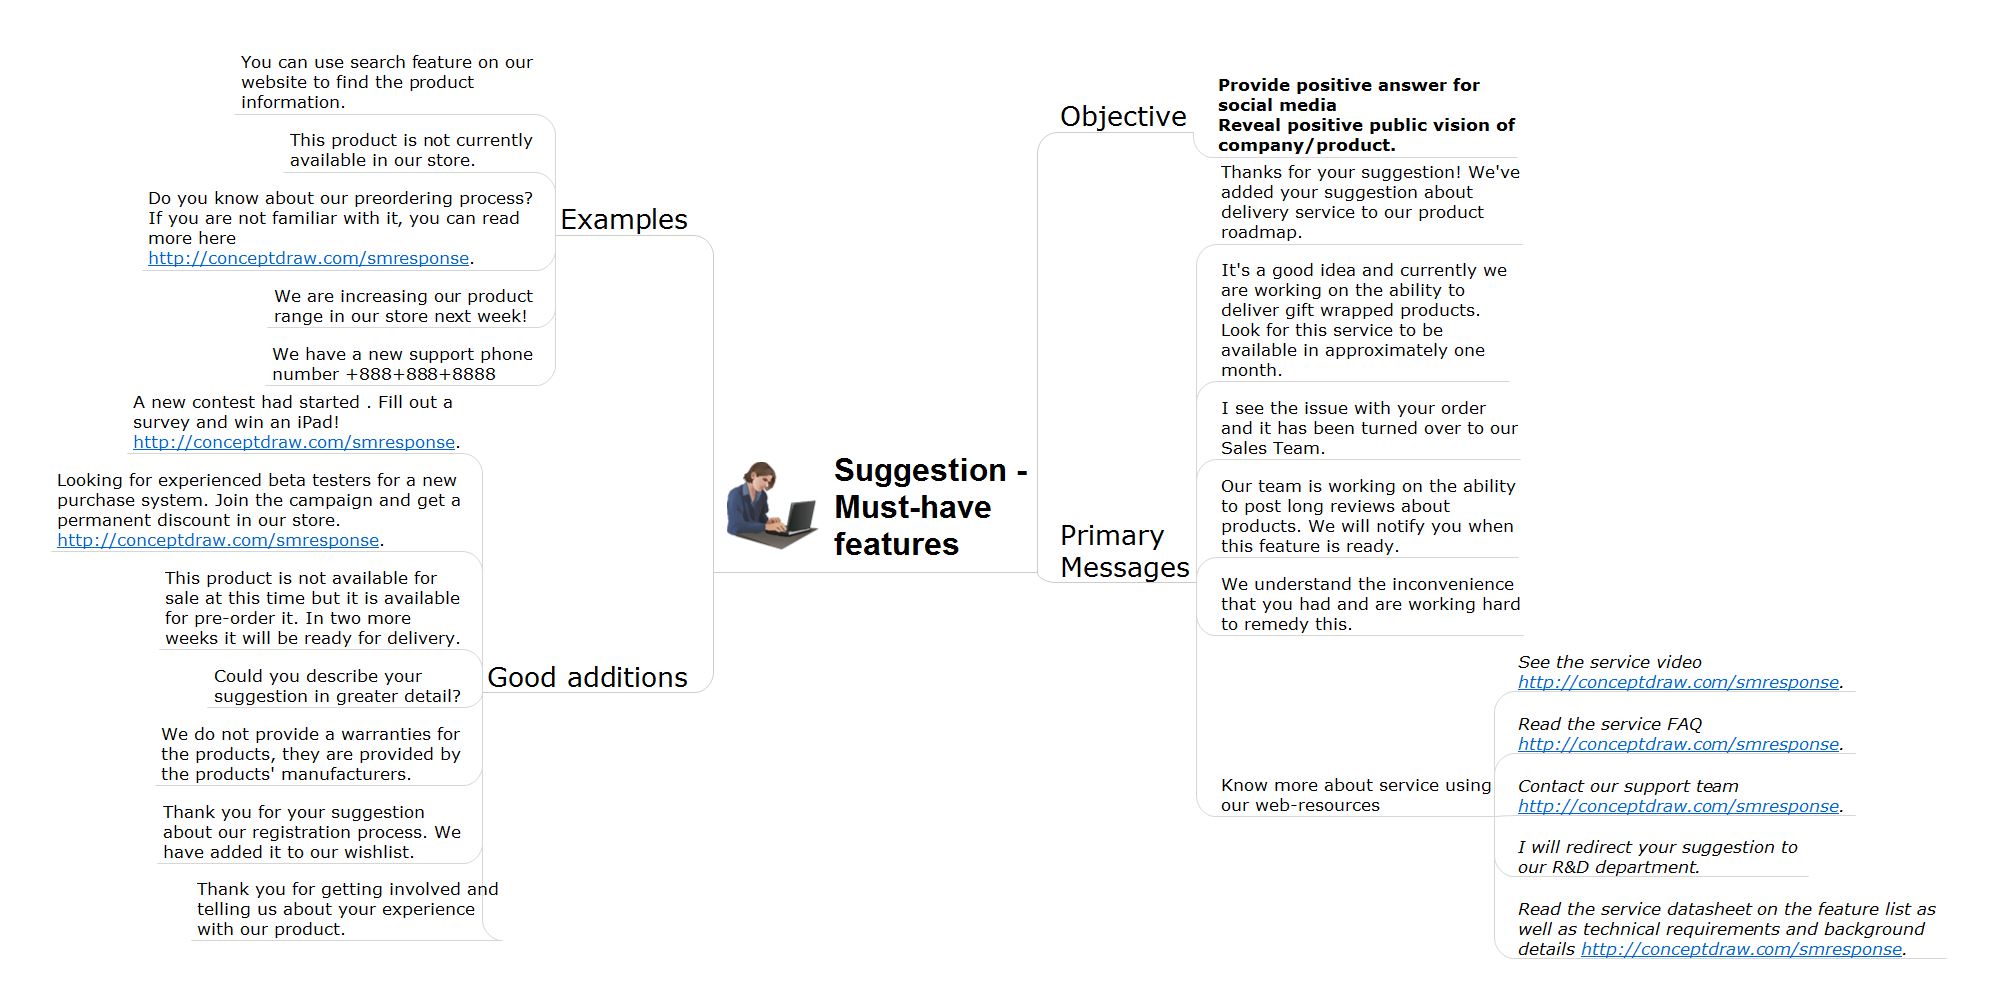
Social Media Flowchart Symbols

Social media is a popular view of mass communication which allows people, companies and organizations create, share, discover, modify, access, comment, discuss and exchange information through the Internet. Social Media Response solution for ConceptDraw DIAGRAM provides collection of 10 libraries with diversity of predesigned vector social media flowchart symbols for fast and easy creating interactive Social Media Flowcharts, Response Charts and Action Mind Maps.

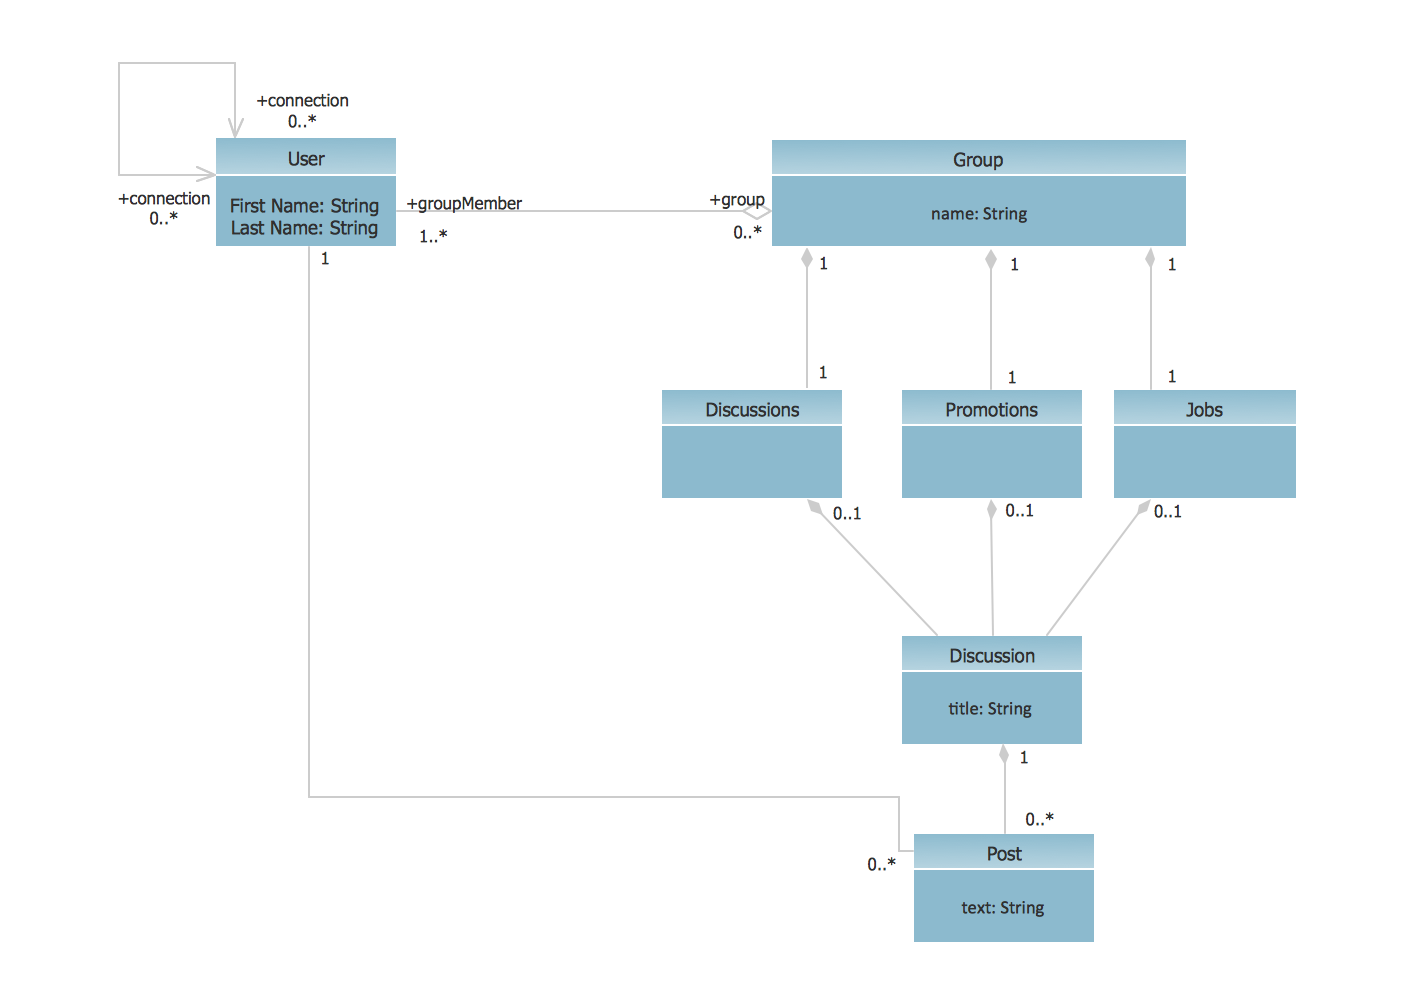
UML Class Diagram Example - Social Networking Site

UML Diagrams Social Networking Sites Project. This sample was created in ConceptDraw DIAGRAM diagramming and vector drawing software using the UML Class Diagram library of the Rapid UML Solution from the Software Development area of ConceptDraw Solution Park.
This sample shows the structure of the popular social networking site Linkedin and is used in the business field, in IT, at the projection and creating of the social networking sites.

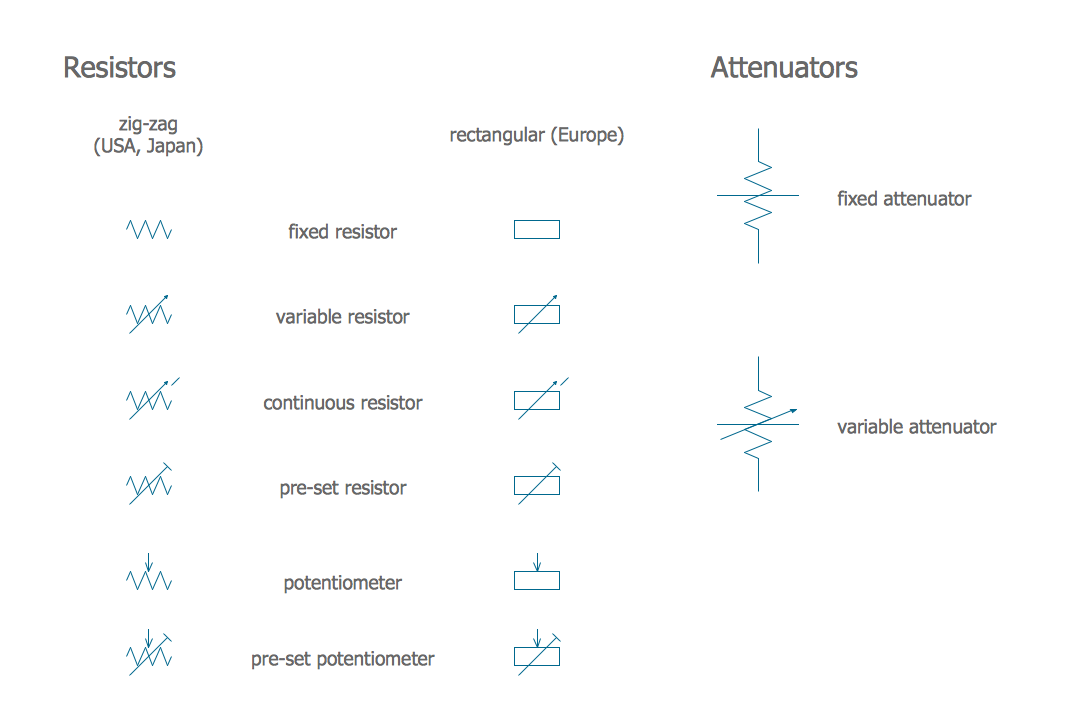
Electrical Symbols — Resistors
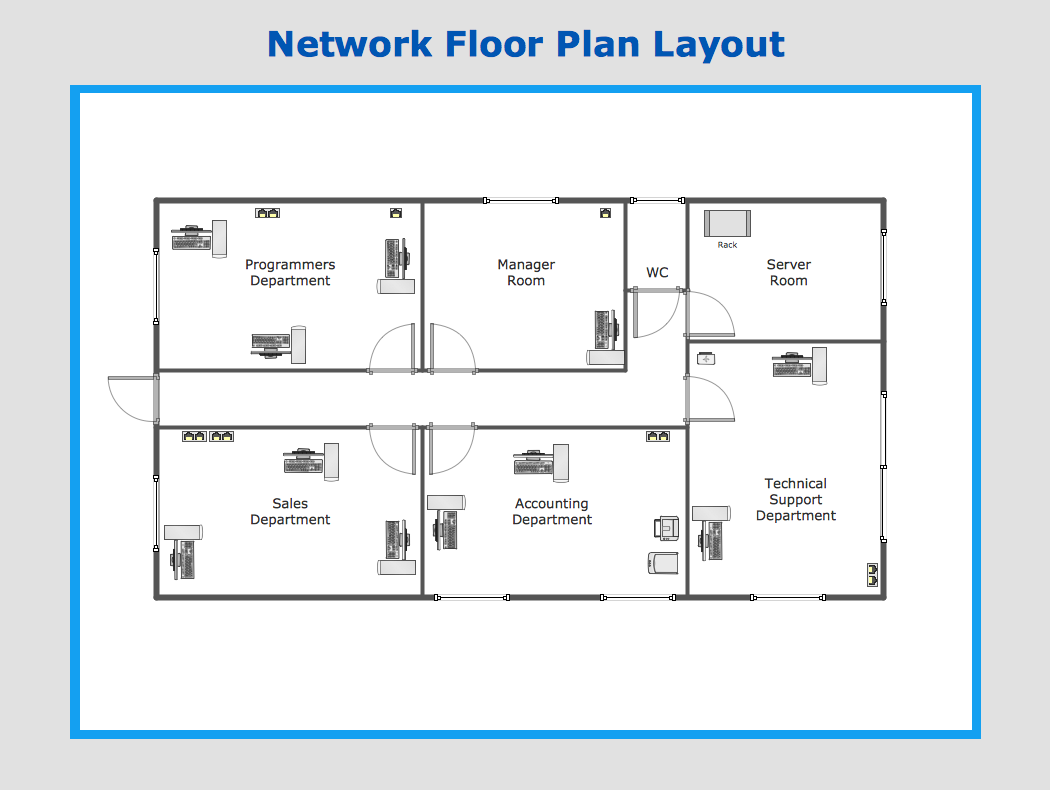
A resistor is a passive two-terminal electrical component that implements electrical resistance as a circuit element. Resistors may be used to reduce current flow, and, at the same time, may act to lower voltage levels within circuits. In electronic circuits, resistors are used to limit current flow, to adjust signal levels, bias active elements, and terminate transmission lines among other uses. Fixed resistors have resistances that only change slightly with temperature, time or operating voltage. Variable resistors can be used to adjust circuit elements (such as a volume control or a lamp dimmer), or as sensing devices for heat, light, humidity, force, or chemical activity.

26 libraries of the Electrical Engineering Solution of ConceptDraw DIAGRAM make your electrical diagramming simple, efficient, and effective. You can simply and quickly drop the ready-to-use objects from libraries into your document to create the electrical diagram.

Network Layout

ConceptDraw has 1004 vector stencils in the 40 libraries that helps you to start using software for designing your own Network Layout Diagrams. You can use the appropriate stencils from Computer and Network Diagrams object libraries.
HelpDesk

How to Draw a Circular Arrows Diagram

The cyclic recurrence is a fundamental property of multiple systems. The cycle is a process which consists of elements (phases, stages, stages) following each other. Many processes in astronomy, biology, chemistry, physics, mathematics, etc. have a cycle properties. It is also widely used in information technologies and marketing analysis. Graphical representation of cyclic processes can have many forms. It can be a circle, parabola, hyperbola, ellipse, and others. A Circular Arrows Diagram is used as one of the statistical charts in the business, mass media and marketing. ConceptDraw DIAGRAM provides tools for making easy drawing Circular Arrows Diagrams.

Best Diagramming Software for macOS

ConceptDraw DIAGRAM creates drawings, flowcharts, block diagrams, bar charts, histograms, pie charts, divided bar diagrams, line graphs, area charts, scatter plots, circular arrows diagrams, Venn diagrams, bubble diagrams with great visual appeal on Mac OS X.
How to Draw a Bubble Chart

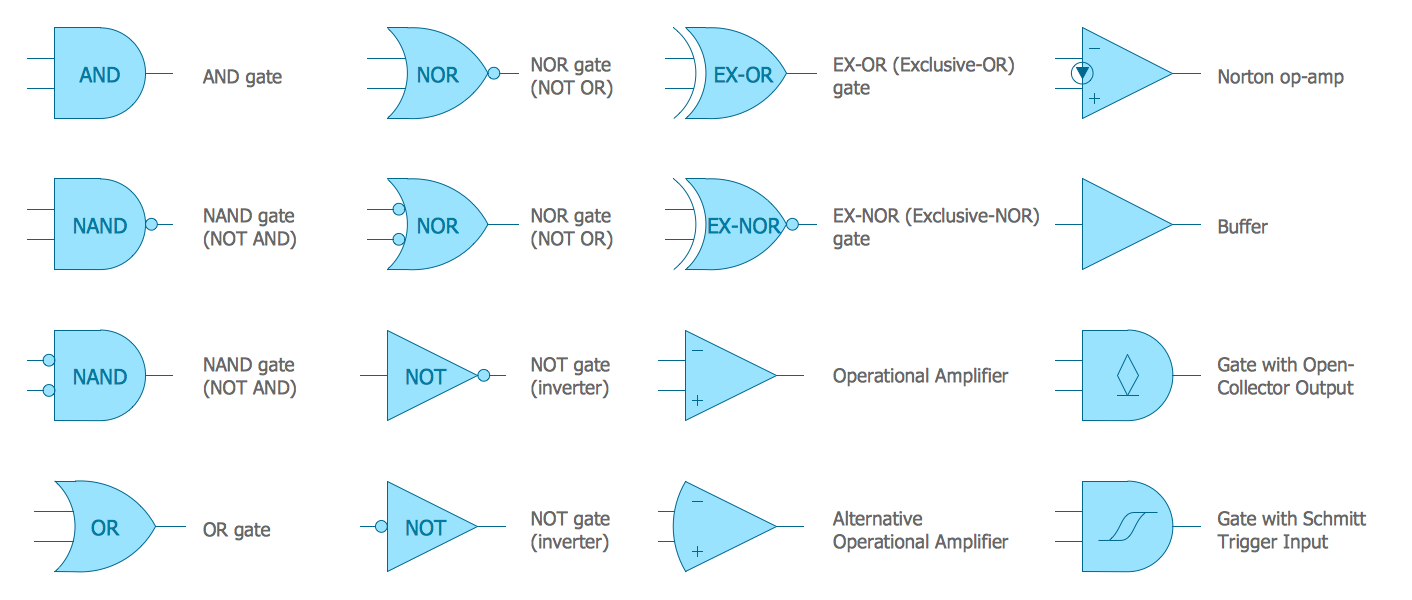
Electrical Symbols — Logic Gate Diagram

In electronics, a logic gate is an idealized or physical device implementing a Boolean function; that is, it performs a logical operation on one or more logical inputs, and produces a single logical output. Depending on the context, the term may refer to an ideal logic gate, one that has for instance zero rise time and unlimited fan-out, or it may refer to a non-ideal physical device
26 libraries of the Electrical Engineering Solution of ConceptDraw DIAGRAM make your electrical diagramming simple, efficient, and effective. You can simply and quickly drop the ready-to-use objects from libraries into your document to create the electrical diagram.

Target Diagram

Target Diagram is a convenient and visual way of presentation information which is popular and widely used in marketing, business and economics. ConceptDraw DIAGRAM diagramming and vector drawing software extended with Target and Circular Diagrams solution from the Marketing area of ConceptDraw Solution Park is ideal for fast and easy drawing a Target Diagram.

Best Diagramming

Need to draw a diagram, process chart, flowchart, organizational chart, graphic design? ConceptDraw can help you to make professional graphic documents quickly.
How to Draw a Bubble Chart