Flow Chart Diagram Examples

"Media (singular medium) are the storage and transmission channels or tools used to store and deliver information or data. It is often referred to as synonymous with mass media or news media, but may refer to any means of information communication. ...
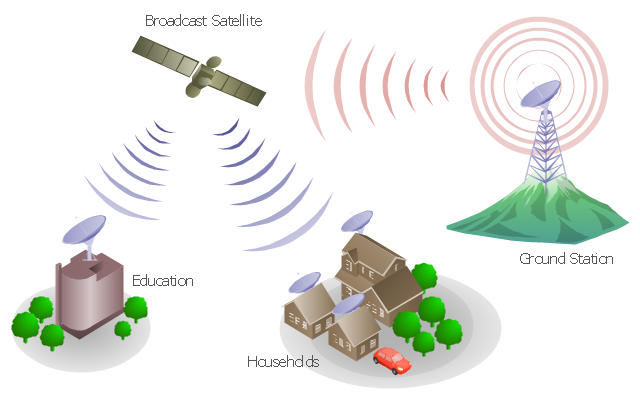
Analog telecommunications include some radio systems, historical telephony systems, and historical TV broadcasts.
Digital telecommunications allow for computer-mediated communication, telegraphy, and computer networks.
Modern communication media now allow for intense long-distance exchanges between larger numbers of people (many-to-many communication via e-mail, Internet forums, and teleportation). On the other hand, many traditional broadcast media and mass media favor one-to-many communication (television, cinema, radio, newspaper, magazines, and also facebook)." [Media (communication). Wikipedia]
This communication medium diagram example was created using the ConceptDraw PRO diagramming and vector drawing software extended with the Telecommunication Network Diagrams solution from the Computer and Networks area of ConceptDraw Solution Park.
Telecommunication network diagram
Social Media Flowchart Symbols

HelpDesk
How to Draw a Circular Arrows Diagram Using ConceptDraw PRO

Basic Diagramming


Percentage Pie Chart. Pie Chart Examples

Pie Chart Examples and Templates

Pie Donut Chart. Pie Chart Examples

 Education Package
Education Package is a comprehensive set of multifarious graphical solutions from ConceptDraw Solution Park, collected together in help to ConceptDraw PRO users working in a field of science, education and training, which is aimed at improving the quality of education and helping to design with ease variety of interesting and colorful educational materials, diagrams, charts and maps. Use it to present the information and knowledge in an interesting, clear, structured and simple form to achieve a success in education and pedagogy, to maintain the interest of students and pupils throughout the whole learning process, at the lectures, lessons and even during independent work with additional materials, to contribute to better perception of scientific information by listeners during the conferences and reports.
UML Diagram for Mac

- Computer and Network Package | Explain Mass Media With Diagram
- Diagram Of Mass Communication
- Mass Media Tree Diagram
- Mass Media Flow Chart
- Simple Flow Chart In Mass Media
- Pie Charts | Marketing Diagrams | Mass Media Digram
- Graphs And Charts In Mass Communication
- Van Diagram Mass Communication
- Business Mass Media Communication Diagram