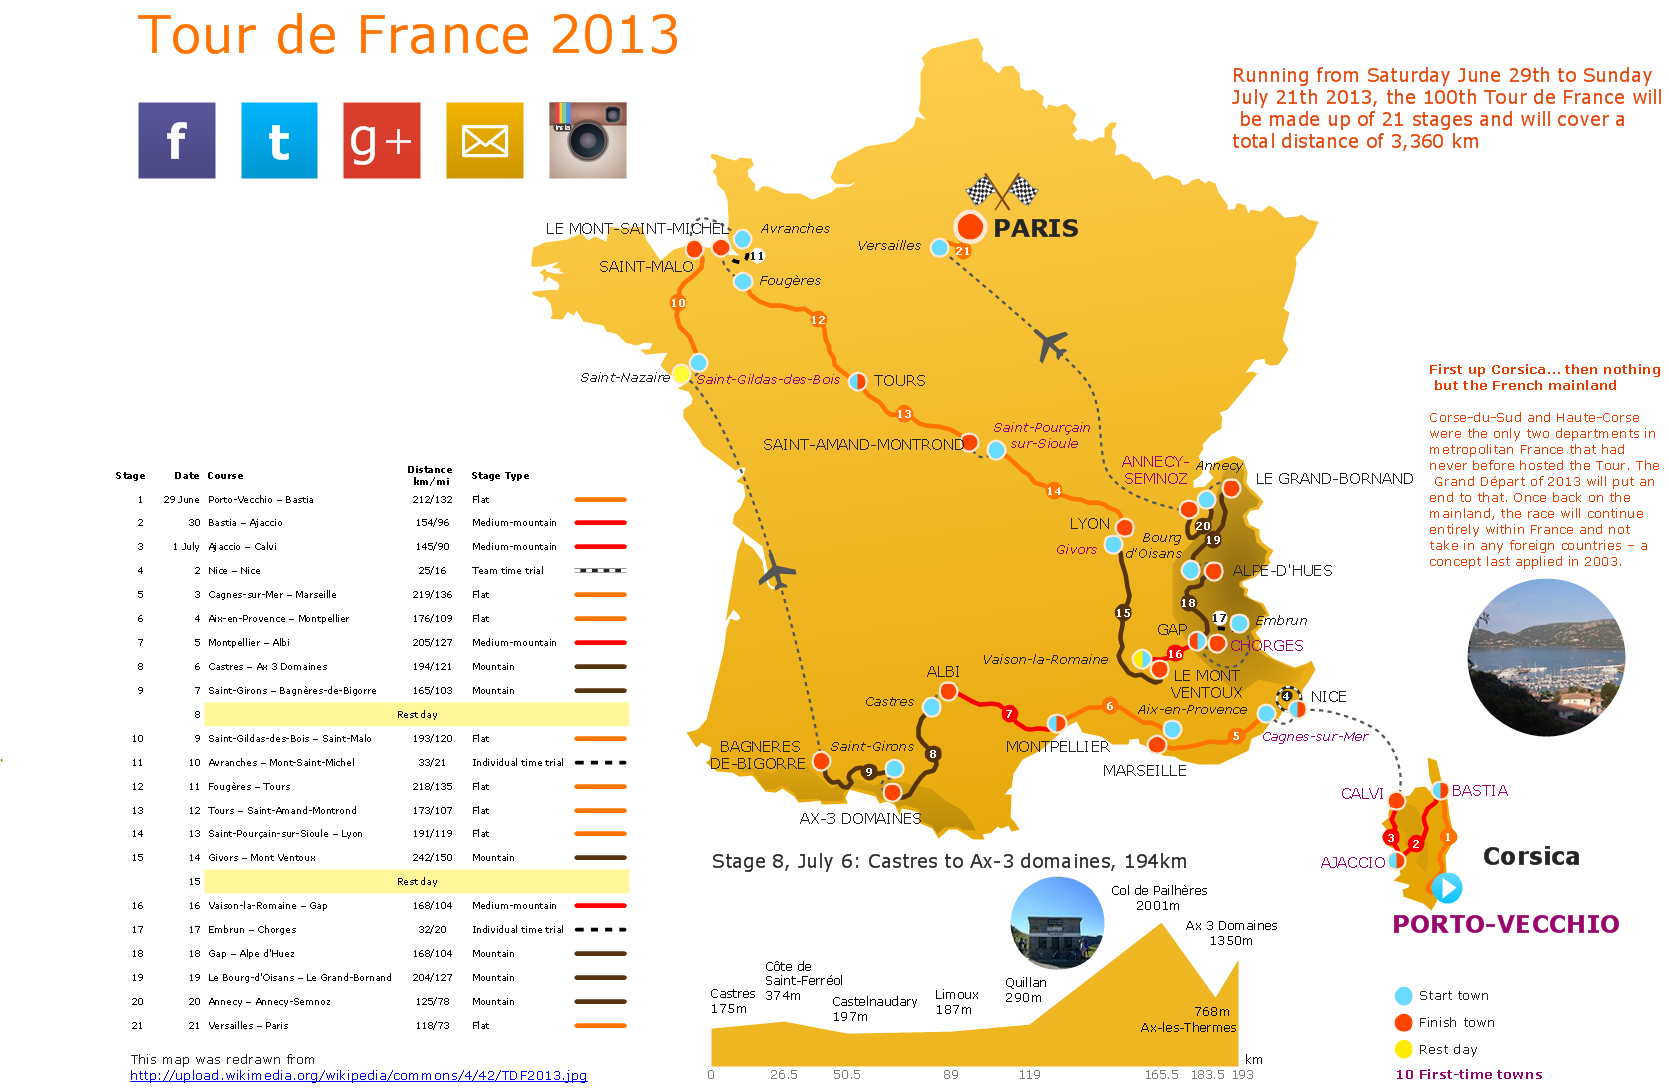
Design Pictorial Infographics. Design Infographics
In the course of recent decades data visualization went through significant development and has become an indispensable tool of journalism, business intelligence and science. The way visual information may be conveyed is not limited simply to static or dynamic representation, it can also be interactive. Infographics can be conditionally divided into several general levels. Primarily, this is level of visualization of information, its interpretation and association on any ground. Second level can be defined as a visualization of knowledge, depiction of thoughts and ideas in the form of images or diagrams. Finally, the level of data visualization, which processes data arrays in charts, enabling the information to be more clearly perceived. You can also identify the main approaches to the creation of infographics: exploratory and narrative. Exploratory method insists on minimalist design in favor of data precision without unnecessary details and is common for scientific researches and anaSample Pictorial Chart. Sample Infographics
Sample Pictorial Chart - Pictorial Infographics solution provides easy-to-use design infographics drawing tools, large collection of different sample infographics and infograms, sample pictorial chart and templates to be filled in, and 10 libraries with great quantity of predesigned vector pictograms.Use Pictorial Infographics solution to draw your own design pictorial infographics documents quick and easy.
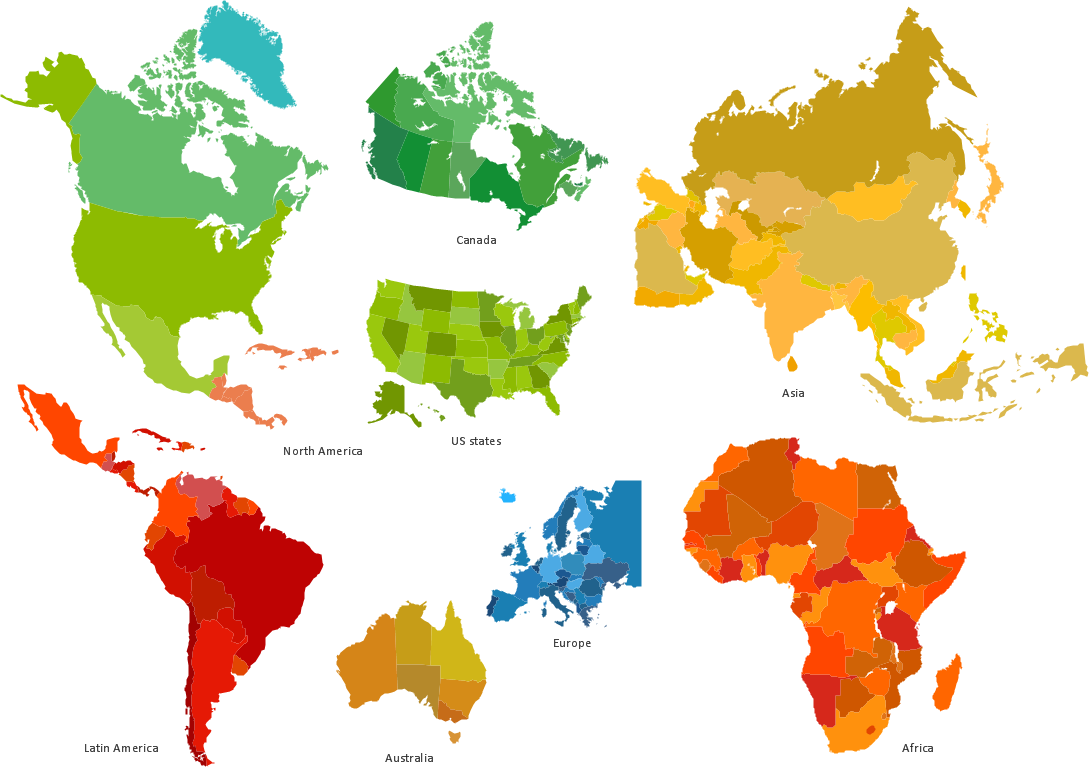
Spatial Infographics
Spatial infographics solution extends ConceptDraw DIAGRAM software with infographic samples, map templates and vector stencils libraries with design elements for drawing spatial information graphics.
HelpDesk
How to Make PowerPoint Presentation of Data Driven Infographics
ConceptDraw DIAGRAM can be used as a tool for creating data-driven infographics. It allows you to draw data driven using the special templates and vector stencils libraries. ConceptDraw DIAGRAM allows you to make an MS PowerPoint Presentation from your Data-driven infographics in a few simple steps.Spatial infographics Design Elements: Location Map
Infographic Design Elements for visually present various geographically distributed information.HelpDesk
How to Create Management Infographics
Management might want to communicate a basic workflow for each division of the company, visualize business strategy and decision processes, or display a certain business training concept. In this case, an infographic can be more text heavy and use illustrations to establish a timeline, process, or step-by-step sequence of events.ConceptDraw DIAGRAM can be used as a tool for creating management infographics. It allows you to draw infographics quickly and easily using the special templates and vector stencils libraries. Infographics can be used to quickly communicate a message, to simplify the presentation of large amounts of data, to see data patterns and relationships, and to monitor changes in variables over time. It can contain bar graphs, pie charts, histograms, line charts, e.t.c.
HelpDesk
How to Create Data-Driven Infographics
Data-driven infographics are used in wildly disparate areas of business and commerce. To make effective Data-driven infographics, it's useful to have a wide variety of graphical elements — icons, clipart, stencils, charts, and graphs — to illustrate your diagram. ConceptDraw Data-driven Infographics solution provides all the tools you need to present data as described by this article — as well as the charts mentioned previously, you can find histograms, divided bar charts, ring charts, line graphs, and area charts — meaning you can find the perfect medium for displaying a certain type of data. It allows you to draw data-driven infographics quickly and easily using the special templates and vector stencils libraries. It can be used to quickly communicate a message, to simplify the presentation of large amounts of data, to see data patterns and relationships, and to monitor changes in variables over time.Transportation Infographics
ConceptDraw is a visualization Software for making transportation infographics. Infographics design vector elements and vector graphics which will surely help you in your design process.- CS Odessa Announces Marketing Infographics Solution for ...
- CS Odessa Announces Management Infographics Solution for ...
- How to Add Data-driven Infographics to a MS Word Document Using ...
- New Education Infographics Solution Now Available for ...
- Brilliant Examples of Infographics Map, Transport, Road ...
- How to Create Data-driven Infographics | How to Add Data-driven ...
- Design Pictorial Infographics . Design Infographics | OSHA HAZCOM ...
- Sample Pictorial Chart. Sample Infographics
- Spatial infographics Design Elements: Location Map | Design ...
- How to Create Education Infographics | Make an Infographic | How ...
- ERD | Entity Relationship Diagrams, ERD Software for Mac and Win
- Flowchart | Basic Flowchart Symbols and Meaning
- Flowchart | Flowchart Design - Symbols, Shapes, Stencils and Icons
- Flowchart | Flow Chart Symbols
- Electrical | Electrical Drawing - Wiring and Circuits Schematics
- Flowchart | Common Flowchart Symbols