"A website, also written as Web site, web site, or simply site, is a set of related web pages served from a single web domain. A website is hosted on at least one web server, accessible via a network such as the Internet or a private local area network through an Internet address known as a Uniform resource locator. All publicly accessible websites collectively constitute the World Wide Web.
A webpage is a document, typically written in plain text interspersed with formatting instructions of Hypertext Markup Language (HTML, XHTML). A webpage may incorporate elements from other websites with suitable markup anchors.
Webpages are accessed and transported with the Hypertext Transfer Protocol (HTTP), which may optionally employ encryption (HTTP Secure, HTTPS) to provide security and privacy for the user of the webpage content. The user's application, often a web browser, renders the page content according to its HTML markup instructions onto a display terminal.
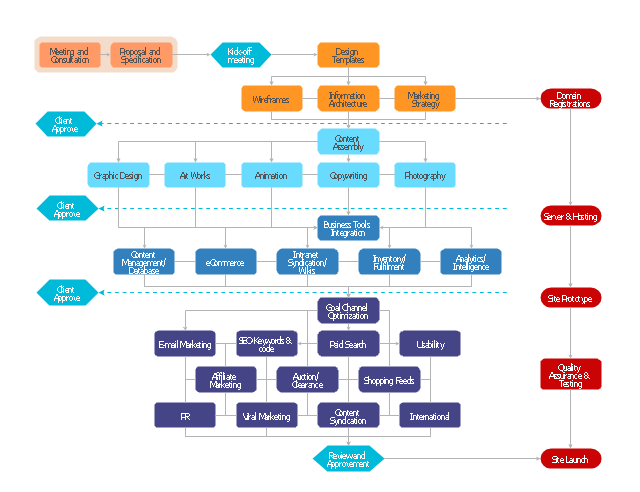
The pages of a website can usually be accessed from a simple Uniform Resource Locator (URL) called the web address. The URLs of the pages organize them into a hierarchy, although hyperlinking between them conveys the reader's perceived site structure and guides the reader's navigation of the site which generally includes a home page with most of the links to the site's web content, and a supplementary about, contact and link page." [Website. Wikipedia]
The flow chart example "Website launch" was created using the ConceptDraw PRO diagramming and vector drawing software extended with the Flowcharts solution from the area "What is a Diagram" of ConceptDraw Solution Park.
A webpage is a document, typically written in plain text interspersed with formatting instructions of Hypertext Markup Language (HTML, XHTML). A webpage may incorporate elements from other websites with suitable markup anchors.
Webpages are accessed and transported with the Hypertext Transfer Protocol (HTTP), which may optionally employ encryption (HTTP Secure, HTTPS) to provide security and privacy for the user of the webpage content. The user's application, often a web browser, renders the page content according to its HTML markup instructions onto a display terminal.
The pages of a website can usually be accessed from a simple Uniform Resource Locator (URL) called the web address. The URLs of the pages organize them into a hierarchy, although hyperlinking between them conveys the reader's perceived site structure and guides the reader's navigation of the site which generally includes a home page with most of the links to the site's web content, and a supplementary about, contact and link page." [Website. Wikipedia]
The flow chart example "Website launch" was created using the ConceptDraw PRO diagramming and vector drawing software extended with the Flowcharts solution from the area "What is a Diagram" of ConceptDraw Solution Park.
Flowchart - Website launch
HelpDesk
Flowchart Software Free Download

Basic Diagramming Flowchart Software

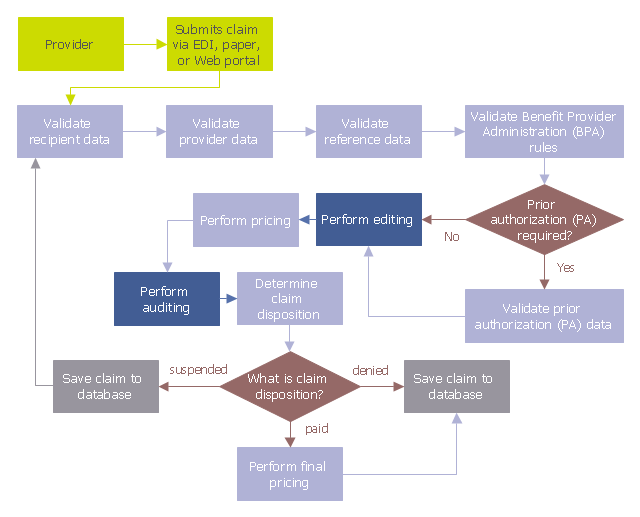
This audit flowchart sample was created on the base of the figure illustrating the webpage "Introduction to Claims Edits, Audits, Error Status Codes, and EOBs" from the website of the Ohio Department of Medicaid.
"Process.
As claims are submitted and processed, the data on the claim is validated against a series of rules, edits, and audits. Review the flowchart below to follow the sequence in which claim data is processed to see where edits and audits impact the claim adjudication process." [medicaid.ohio.gov/ PROVIDERS/ MITS/ MITSNonProviderCommunications/ MITSOnlineTutorials/ IntroductiontoClaimsEdits,Audits.aspx]
The audit flowchart example "Claim data processing" was created using the ConceptDraw PRO diagramming and vector drawing software extended with the Audit Flowcharts solution from the Finance and Accounting area of ConceptDraw Solution Park.
www.conceptdraw.com/ solution-park/ finance-audit-flowcharts
Audit flowchart
Flow Chart Symbols

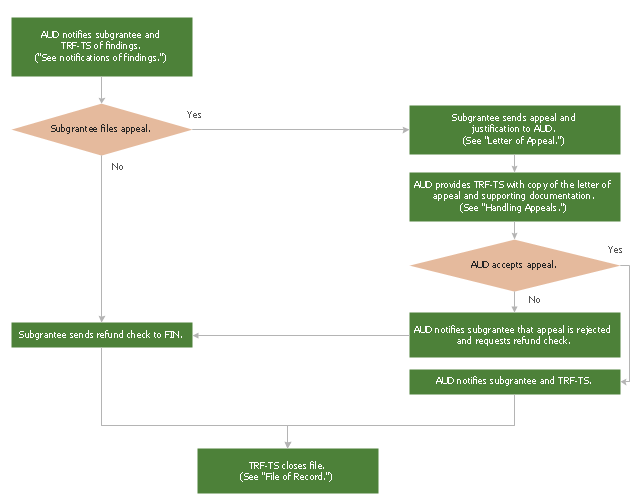
This audit flowchart sample was created on the base of the figure illustrating the webpage "Section 5: Resolving Audit Findings Pertaining to Site Audits" from the website of TxDOT Online Manuals.
"Site Audits.
In addition to audit coverage utilizing the single audit approach, The Texas Department of Transportation (TxDOT) Audit Office (AUD) conducts requested site audits each year on selected projects. Site audits are handled using AUD’s normal site audit procedures. AUD forwards any findings noted during the audit directly to the subgrantee for collection of the moneys due or other resolution as appropriate. Information copies are provided to the TRF-TS program managers and to the districts when appropriate." [onlinemanuals.txdot.gov/ txdotmanuals/ tfc/ resolving_ audit_ findings_ pertaining_ to_ site_ audits.htm]
The audit flowchart example "Overview of resolution process following an Audit Office finding" was created using the ConceptDraw PRO diagramming and vector drawing software extended with the Audit Flowcharts solution from the Finance and Accounting area of ConceptDraw Solution Park.
www.conceptdraw.com/ solution-park/ finance-audit-flowcharts
Audit flowchart
Basic of Flowchart: Meaning and Symbols


Website Wireframe

Contoh Flowchart

This flowchart example was created on the base of land sales process diagram from the Property management webpage of the VicRoads website.
[www.vicroads.vic.gov.au/ planning-and-projects/ property-services/ property-management]
"VicRoads or the Roads Corporation of Victoria is a statutory corporation which is the state road and traffic authority in the state of Victoria, Australia. It is responsible for maintenance and construction of the state arterial road network, as well as driver licensing and vehicle registration. VicRoads has broad responsibility for road safety policy and research. It is also responsible for regulating the accident towing industry in Victoria." [VicRoads. Wikipedia]
"Sales Process.
Once it has been established with the relevant VicRoads Regions/ Projects and other business areas that properties are identified as surplus to VicRoads’ operational needs, they are incorporated in the VicRoads annual sales program.
Following approval: relevant VicRoads Regional Manager and the VicRoads Chief Executive (and in some circumstances Minster for Public Transport and Roads) must approve all land deemed surplus and available for disposal.
The method of sale is then determined and consultant advice is sought:
(1) Planning.
(2) Valuer General Victoria (Valuer General’s office must provide a valuation for all sales).
(3) Government Land Monitor (Land Monitor approval is sought if the value exceeds $750,000).
(4) Environmental.
(5) Local Council." [www.vicroads.vic.gov.au/ planning-and-projects/ property-services/ property-management]
The example "Land sales process flowchart" was created using the ConceptDraw PRO diagramming and vector drawing software extended with the Sales Flowcharts solution from the Marketing area of ConceptDraw Solution Park.
Sales process chart

 Accounting Flowcharts
Accounting Flowcharts solution extends ConceptDraw DIAGRAM software with templates, samples and library of vector stencils for drawing the accounting flow charts.
Flowchart Design Flowchart Symbols, Shapes, Stencils and Icons


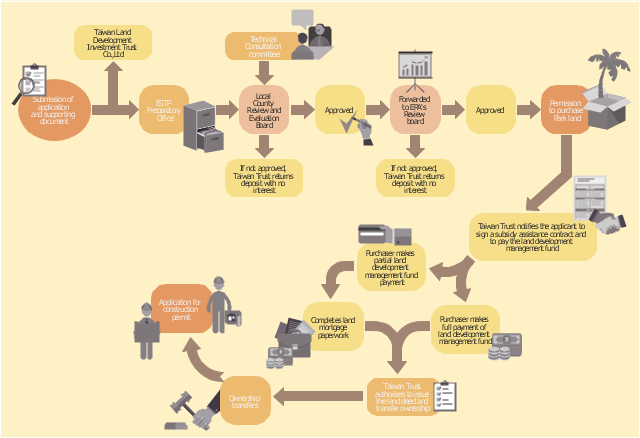
This example of business infographics was designed on the base of flowchart in the webpage "Establishing Operations in an Environmental Protection Park" from the website of Taiwan Department of Investment Services, Ministry of Economic Affairs.
"Upon registration of the company, the "Guideline for Operation and Management of Environmental Science and Technology Park Promotion Program" and "Guideline for Execution of Subsidies for Environmental Science and Technology Park Promotion Program" shall be followed for applying for admission to the Park. Any foreigner who wishes to invest in and build a factory in the Park shall apply to the local Preparatory Office of ESTP for admission approval. It will take approximately two months to secure such approval from the application submission date. The investment and construction application procedures prescribed by preparatory Office of ESTP in Southern Taiwan are shown below for reference." [investtaiwan.nat.gov.tw/ eng/ show.jsp?ID=123&MID=2]
The infographics example "Investment and construction application procedures" was created using the ConceptDraw PRO diagramming and vector drawing software extended with the HR Flowcharts solution from the Management area of ConceptDraw Solution Park.
Flowchart infographics
Flowchart Designer

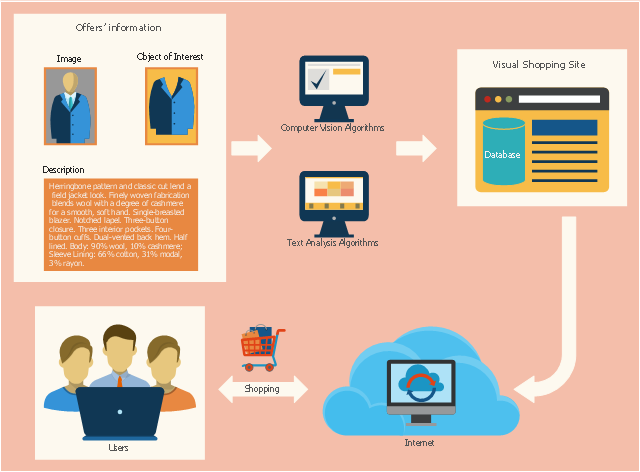
This sales flowchart example was redesigned from the Wikimedia Commons file: Visual shopping scheme.pdf. [commons.wikimedia.org/ wiki/ File:Visual_ shopping_ scheme.pdf]
"Online shopping (sometimes known as e-tail from "electronic retail" or e-shopping) is a form of electronic commerce which allows consumers to directly buy goods or services from a seller over the Internet using a web browser. Alternative names are: e-web-store, e-shop, e-store, Internet shop, web-shop, web-store, online store, online storefront and virtual store. Mobile commerce (or m-commerce) describes purchasing from an online retailer's mobile optimized online site or app." [Online shopping. Wikipedia]
The example "Visual shopping scheme" was created using the ConceptDraw PRO diagramming and vector drawing software extended with the Sales Flowcharts solution from the Marketing area of ConceptDraw Solution Park.
Online shopping flowchart
Business Diagram Software

 HR Flowcharts
The HR Flowcharts solution is ideal for using while creating the HR-related drawings in the ConceptDraw DIAGRAM charting and drawing software, providing with a comprehensive collection of human resources themed icons, connectors, and images from the available stencil libraries, helping illustrating flowcharts, infographics and workflow diagrams.
How to Create a Social Media DFD Flowchart

How To Create a FlowChart using ConceptDraw

- Flowchart | Website launch - Flowchart | Example Process Flow ...
- Website launch - Flowchart | Business diagrams & Org Charts with ...
- Basic Flowchart Symbols and Meaning | Flowchart design ...
- Website launch - Flowchart | Accounting Flowcharts | Website ...
- Flowchart | Website launch - Flowchart | Accounting Flowcharts ...
- Flowchart Software Free Download | Accounting Flowcharts ...
- Website launch - Flowchart | Flowchart | Basic Flowchart Symbols ...
- Basic Flowchart Symbols and Meaning | Flowchart | Website launch ...
- Website launch - Accounting Flowcharts
- Flowchart | Website launch - Flowchart | Contoh Flowchart ...