Flow chart Example. Warehouse Flowchart


TQM Diagram Example

Probability Quality Control Tools

Social Media Response Management DFD Charts - software tools


HR Management Software

Software Work Flow Process in Project Management with Diagram

This sample shows the Workflow Diagram that clearly illustrates stages a BPM consists of and relations between all parts of business. The Workflow Diagrams are used to represent the transferring of data during the work process, to study and analysis the working processes, and to optimize a workflow.
How to Create Presentation of Your Project Gantt Chart

How To Create Onion Diagram

IDEF0 standard with ConceptDraw PRO

Selecting & Creating Flowcharts

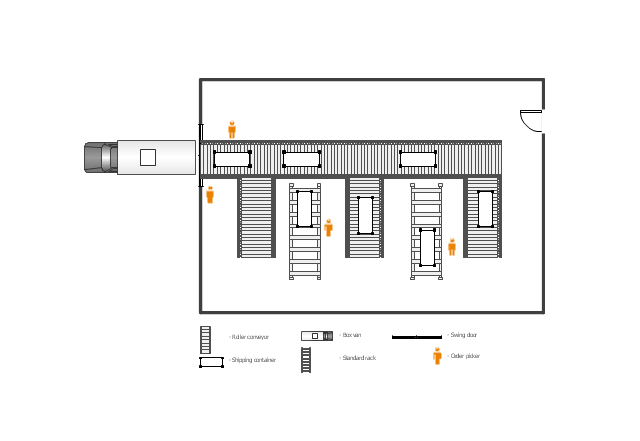
This floor plan example was drawn on the base of slide 27 "Warehouse Layout Floor Plan" of the presentation "Operations Management. Layout Strategy. Chapter 9" from the website of the School of Business Administration at Portland State University. [sba.pdx.edu/ faculty/ karlt/ Ch9/ sld027.htm]
"A conveyor system is a common piece of mechanical handling equipment that moves materials from one location to another. Conveyors are especially useful in applications involving the transportation of heavy or bulky materials. Conveyor systems allow quick and efficient transportation for a wide variety of materials, which make them very popular in the material handling and packaging industries. Many kinds of conveying systems are available, and are used according to the various needs of different industries. There are chain conveyors (floor and overhead) as well. Chain conveyors consist of enclosed tracks, I-Beam, towline, power & free, and hand pushed trolleys." [Conveyor system. Wikipedia]
The floor plan example "Warehouse with conveyor system" was created using the ConceptDraw PRO diagramming and vector drawing software extended with the Plant Layout Plans solution from the Building Plans area of ConceptDraw Solution Park.
Floor plan - Warehouse with conveyor system
Activity Network (PERT) Chart

The vector stencils library "Sales department" contains 49 company department icons.
Use these sales pictograms to draw your sales flowcharts, workflow diagrams and process charts with the ConceptDraw PRO diagramming and vector drawing software.
The vector stencils library "Sales department" is included in the Sales Flowcharts solution from the Marketing area of ConceptDraw Solution Park.
Accounting

Accounts payable

Accounts receivable

Audit

Bank

Board of directors

Copy center

Customer service operator

Customer service technician

Data center

Delivery

Design

Devices management

Distribution

Distribution

Employee

Engineering

Facilities

Finance

Human resource

Devices management

Information systems

International division

International marketing

International sales

Inventory

Legal department

Mail room

Mail service

Management

Manufacturing

Marketing

Motorpool

Online service

Packaging

Payroll

Publications

Purchasing

Quality assurance

Receiving

Reception

Research and development

Sales growth

Scales

Security

Shipping

Suppliers

Telecommunication

Warehouse

Hiring Process

Basic Audit Flowchart. Flowchart Examples

- Warehouse Management Process Flow Chart
- Data Flow Diagram Warehouse Management System
- Warehouse Management Software Flow Diagram
- Flowchart For Enterprise Data Warehouse Management System
- Flow Chart On Enterprise Data Warehouse Management System
- Er Diagram Of Warehouse Management System
- Warehouse Management System Charts
- Warehouse Management Chart
- Process Flowchart | Basic Flowchart Symbols and Meaning | Flow ...
- Flow Chart For Warehouse Management
- Give A Flowchart Of A Warehouse Management
- Warehouse Management Process Flow
- Free Warehouse Management Software
- Warehouse Management Flowchart
- Process Flow Diagram Warehouse Management
- Draw A Good Flowchart Diagram Of A Warehouse Management
- Warehouse Management Flow Chat
- Flowchart Warehouse Management System
- Process Of Warehouse Management System Diagram
- Warehouse Management Workflow