Visual Presentations Made Easy with Diagramming Software


Simple Diagramming

Chart Software for Better Presentations

Concept Maps

 Presentation Clipart
Presentation design elements solution extends ConceptDraw DIAGRAM software with slide samples, templates and vector stencils libraries with design elements of presentation symbols, arrows, callouts, backgrounds, borders and frames, title blocks.
Best Diagramming


 Infographics Area
Solutions of the area What is Infographics from ConceptDraw Solution Park collect templates, samples and vector stencils libraries with design elements for the drawing information graphics.
 ConceptDraw Solution Park
ConceptDraw Solution Park collects graphic extensions, examples and learning materials
Chart Maker for Presentations

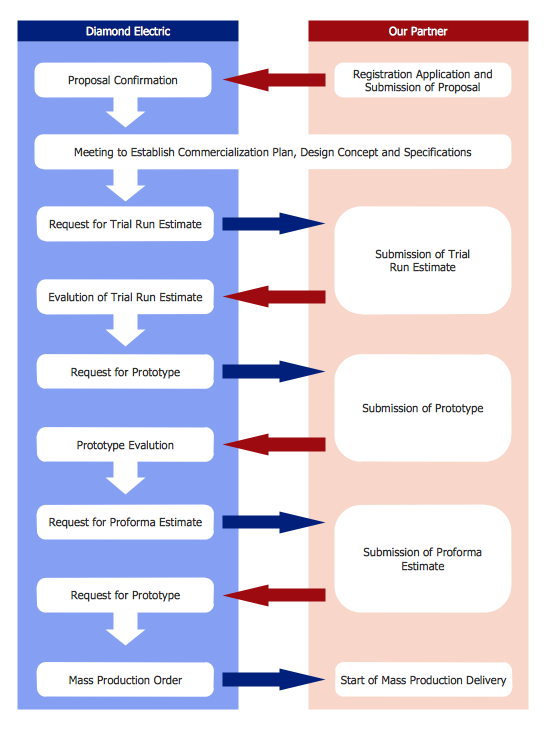
Product Proposal Template
 Picture Graphs
Typically, a Picture Graph has very broad usage. They many times used successfully in marketing, management, and manufacturing. The Picture Graphs Solution extends the capabilities of ConceptDraw DIAGRAM with templates, samples, and a library of professionally developed vector stencils for designing Picture Graphs.
Best Vector Drawing Application for Mac OS X

Data Flow Diagram Process

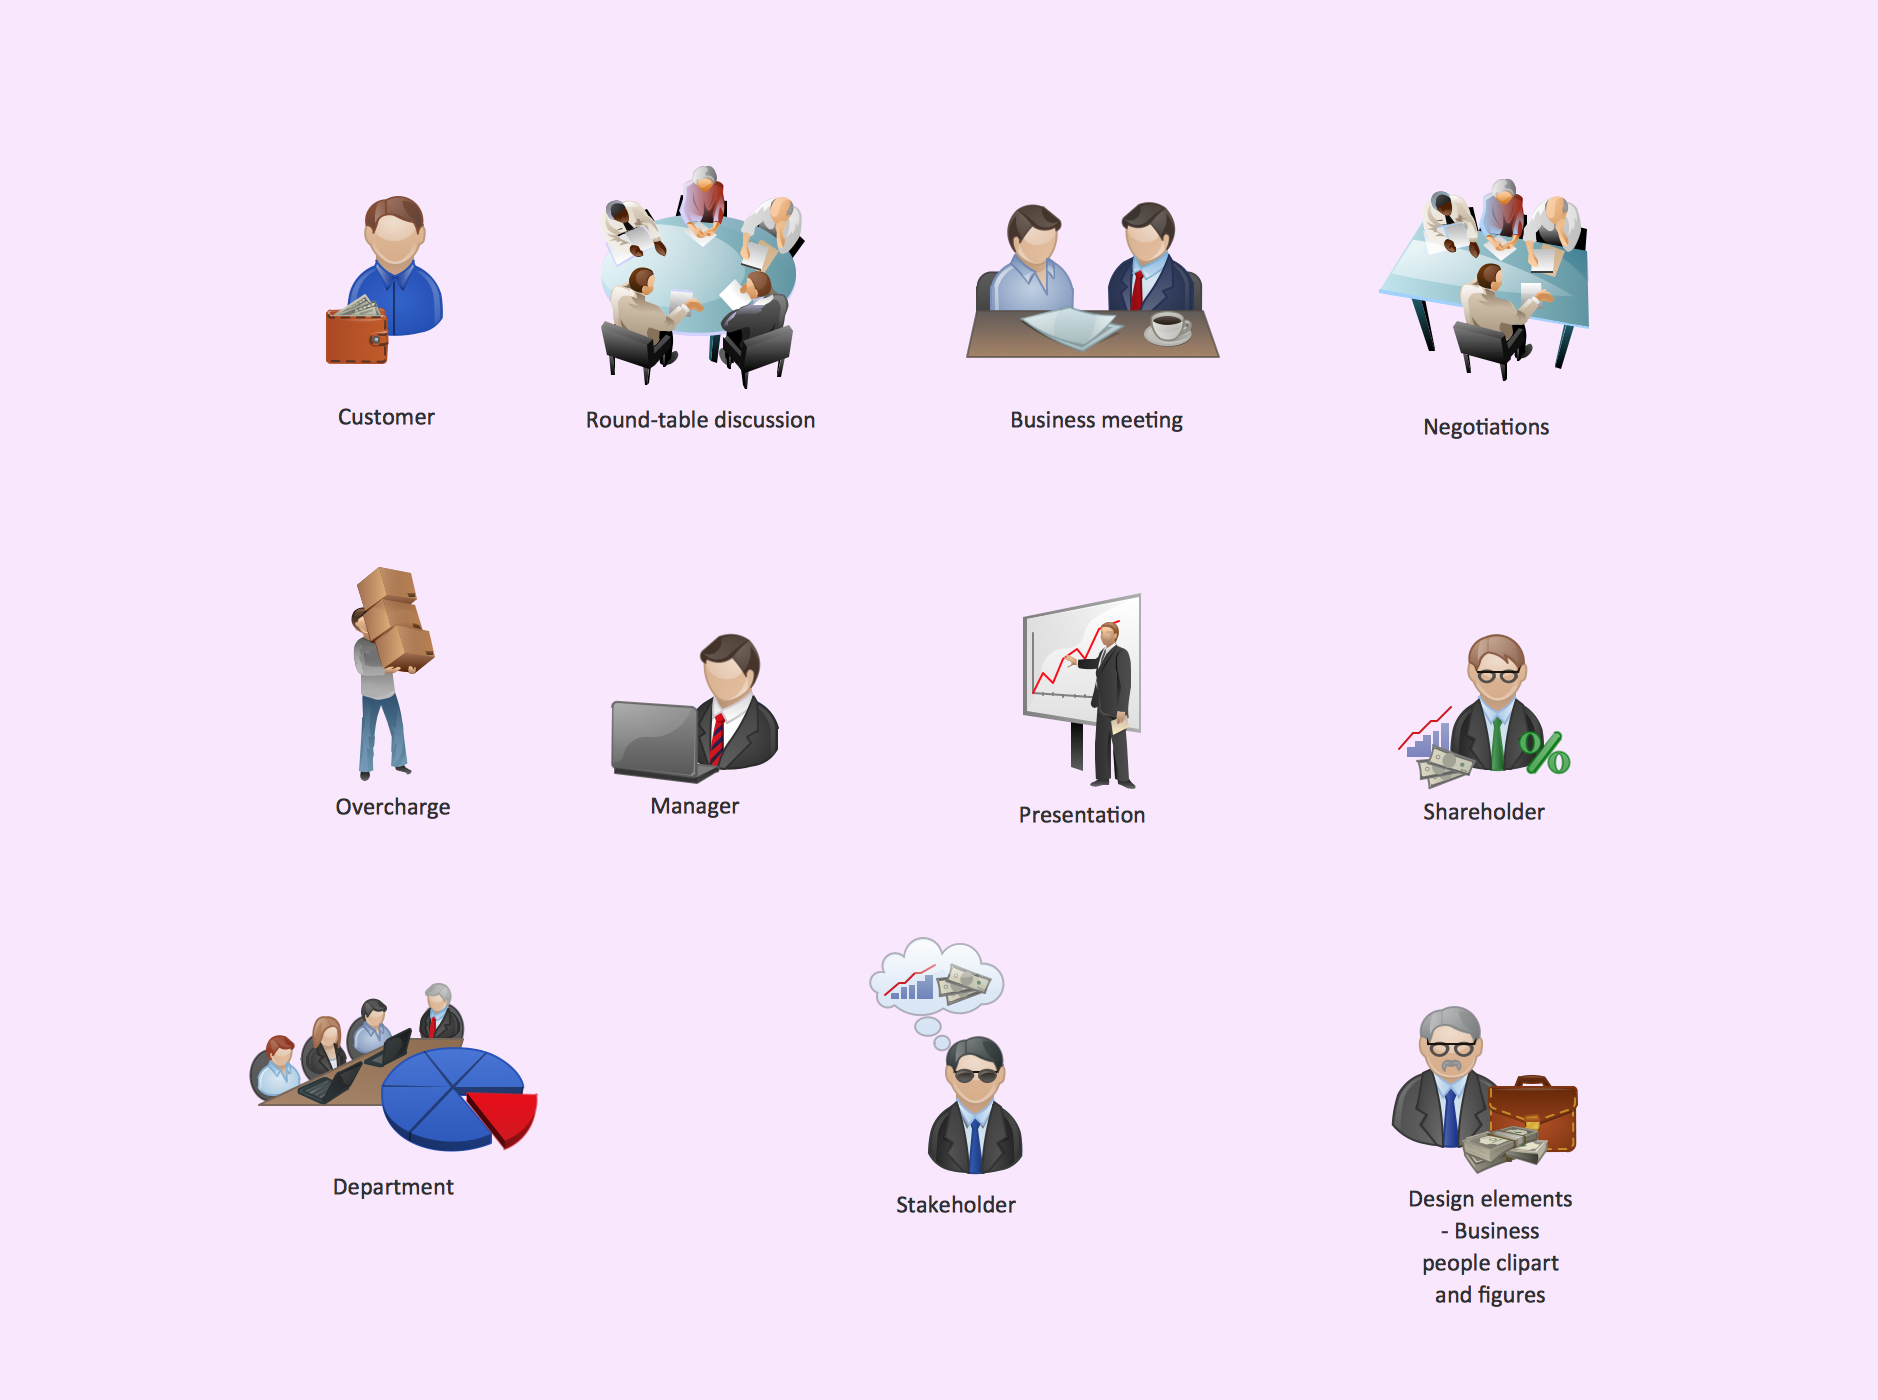
Business People Clipart
HelpDesk
How to Use ConceptDraw Sales Dashboard Solution

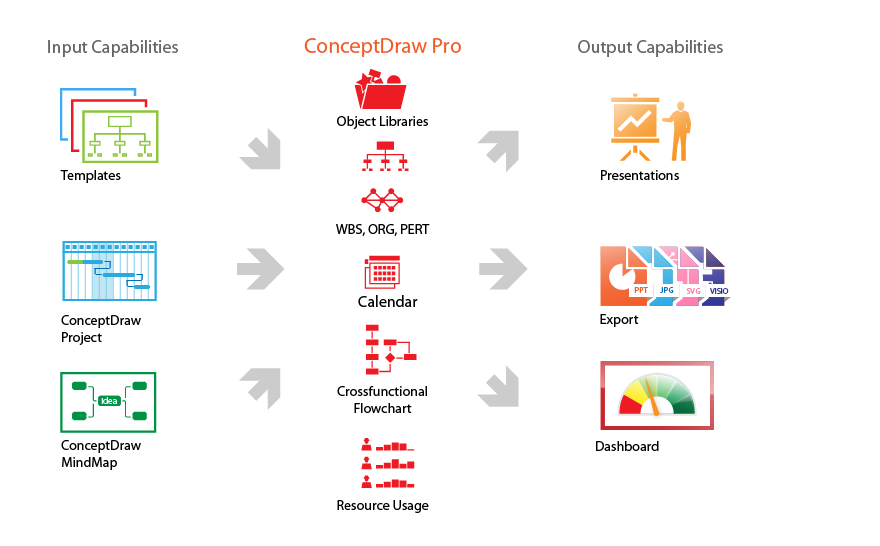
Product Overview
 Winter Sports
The Winter Sports solution from Sport area of ConceptDraw Solution Park contains winter sports illustration examples, templates and vector clipart libraries.
- Visual Presentations Made Easy with Diagramming Software | 3 ...
- Business Diagram Software | Best Vector Drawing Application for ...
- The Best Drawing Program for Mac | Divided Bar Diagrams | Visual ...
- ConceptDraw Solution Park | Visual Presentations Made Easy with ...
- Fishbone Diagram | Visual Presentations Made Easy with ...
- Venn Diagrams | Visual Presentations Made Easy with ...
- Selecting & Creating Flowcharts | Visual Presentations Made Easy ...
- Visual Presentations Made Easy with Diagramming Software | 3 ...
- Best Program to Make Diagrams | Basic Diagramming | Visual ...
- Basic Diagramming | Best Software to Draw Diagrams | Visual ...
- Basic Diagramming | Block Diagrams | Visual Presentations Made ...
- The Best Choice for Creating Diagram | Visual Presentations Made ...
- Visual Presentations Made Easy with Diagramming Software | Basic ...
- Histograms | Visual Presentations Made Easy with Diagramming ...
- Examples of Flowcharts, Org Charts and More | Visual Presentations ...
- Visual Presentations Made Easy with Diagramming Software | The ...
- Illustration | Basic Diagramming | Presentation Clipart |
- Illustration | Design elements - Technology | Illustration Area |
- How to Use Skype for Sharing Documents | Presentation Exchange ...
- Visual Presentations Made Easy with Diagramming Software | Best ...