ConceptDraw DIAGRAM Compatibility with MS Visio

 Object-Role Modeling (ORM) Diagrams
Object-role Modeling (ORM) Diagram solution with powerful vector diagramming and data modeling tools, large quantity of specially developed samples and examples, and rich variety of vector objects corresponding to common ORM notation, ideally suits for developing the comprehensive, clear and visual Object-role Modeling (ORM) diagrams and schematics, understandable for all interested people from the different fields and business directions, for designing the ORM models, and demonstrating advantages from the use of ORM and its notation. It is intended for software developers and computer engineers, specialists in a field of Object-oriented programming (OOP), database architects, web-application constructors and developers, etc.
HelpDesk
How to Open MS Visio® 2013-2019 Files on a Mac®

How to Simplify Flow Charting — Cross-functional Flowchart

Marketing Charts

Risk Analysis


 Seven Management and Planning Tools
Seven Management and Planning Tools solution extends ConceptDraw DIAGRAM and ConceptDraw MINDMAP with features, templates, samples and libraries of vector stencils for drawing management mind maps and diagrams.
HelpDesk
How to Manage Problem Solving Using Seven Management and Planning Tools

 Stakeholder Onion Diagrams
The Stakeholder Onion Diagrams solution supplies ConceptDraw DIAGRAM with powerful tools to simplify the process of creating Stakeholder Onion Diagrams. It includes the set of pre-made vector objects and templates for a quick start, and collection of examples illustrating the solution's power. This solution is useful for all specialists in management and business, especially for those who prefer to use the newest progressive tools.
How to Exchange ConceptDraw MINDMAP Files with Mindjet MindManager

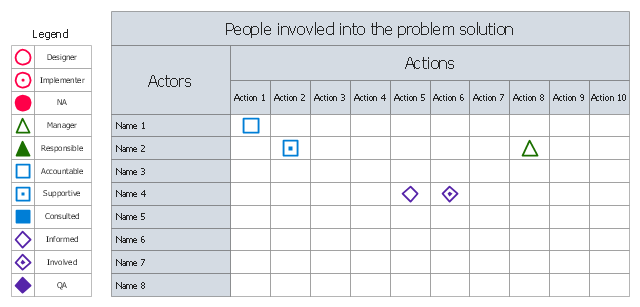
The involvement matrix (responsibility assignment matrix, RAM, RACI matrix, ARCI matrix, linear responsibility chart, LRC) defines the level of involvement and nature of participation . The diagram shows the degree of involvement for all identified parties in the execution of corrective actions.
"Key responsibility roles.
Responsible.
Those who do the work to achieve the task. There is at least one role with a participation type of responsible, although others can be delegated to assist in the work required (see also RASCI below for separately identifying those who participate in a supporting role).
Accountable (also approver or final approving authority).
The one ultimately answerable for the correct and thorough completion of the deliverable or task, and the one who delegates the work to those responsible. In other words, an accountable must sign off (approve) on work that responsible provides. There must be only one accountable specified for each task or deliverable.
Consulted (sometimes counsel).
Those whose opinions are sought, typically subject matter experts; and with whom there is two-way communication.
Informed.
Those who are kept up-to-date on progress, often only on completion of the task or deliverable; and with whom there is just one-way communication." [Responsibility assignment matrix. Wikipedia]
The involvement matrix is one of the Seven Management and Planning Tools (7 MP tools, Seven New Quality Tools).
The person involvement matrix template for the ConceptDraw PRO diagramming and vector drawing software is included in the solution "Seven Management and Planning Tools" from the Management area of ConceptDraw Solution Park.
Person involvement matrix
UML Flowchart Symbols

TQM Tools

Total Quality Management

Technical Flow Chart Example

Bank UML Diagram

Organizational Structure Total Quality Management

 ConceptDraw Solution Park
ConceptDraw Solution Park collects graphic extensions, examples and learning materials
- MS Visio Look a Like Diagrams | Person involvement matrix ...
- MS Visio Look a Like Diagrams | Person involvement matrix ...
- Matrix Organization | Positioning Map | Ansoff Matrix | Matrix Visio
- Person involvement matrix - Template | How To Create an ...
- How To Create an Involvement Matrix | Matrix Organization Structure ...
- Person demotivated by evaluation - Fault tree analysis diagram ...
- Responsibility assignment matrix | Involvement matrix
- ConceptDraw DIAGRAM Compatibility with MS Visio | Influence ...
- Person involvement matrix - Template | Responsibility assignment ...
- Person involvement matrix - Template | Matrix Organization ...