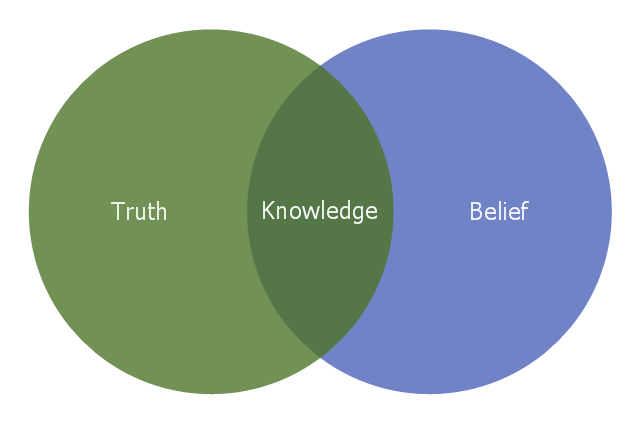
This Venn diagram sample illustrates the Plato's definition of knowledge. It was designed on the base of the Wikimedia Commons file: Belief Venn diagram.svg. [commons.wikimedia.org/ wiki/ File:Belief_ Venn_ diagram.svg]
"Justified true belief is a definition of knowledge that is most frequently credited to Plato and his dialogues. The concept of justified true belief states that in order to know that a given proposition is true, one must not only believe the relevant true proposition, but one must also have justification for doing so. In more formal terms, a subject S knows that a proposition P is true if and only if:
(1) P is true,
(2) S believes that P is true, and
(3) S is justified in believing that P is true" [Justified true belief. Wikipedia]
The Venn diagram example "Knowledge" was created using the ConceptDraw PRO diagramming and vector drawing software extended with the Venn Diagrams solution from the area "What is a Diagram" of ConceptDraw Solution Park.
Venn Diagrams
Venn Diagrams are actively used to illustrate simple set relationships in set theory and probability theory, logic and statistics, mathematics and computer science, linguistics, sociology, and marketing. Venn Diagrams are also often used to visually summarize the status and future viability of a project.
Venn Diagram
Venn diagrams are illustrations used in the branch of mathematics known as set theory. They show the mathematical or logical relationship between different groups of things (sets). A Venn diagram shows all the possible logical relations between the sets.Venn Diagram Template for Word
This template shows the Venn Diagram. It was created in ConceptDraw DIAGRAM diagramming and vector drawing software using the ready-to-use objects from the Venn Diagrams Solution from the "Diagrams" area of ConceptDraw Solution Park.Pyramid Diagram
The DIKW Pyramid refers loosely to a class of models for representing purported structural and/or functional relationships between data, information, knowledge, and wisdom.Multi Layer Venn Diagram. Venn Diagram Example
To visualize the relationships between subsets of the universal set you can use Venn diagrams. To construct one, you should divide the plane into a number of cells using n figures. Each figure in the chart represents a single set of, and n is the number of represented sets. Splitting is done in a way that there is one and only one cell for any set of these figures, the points of which belong to all the figures from the set and do not belong to others. The plane on which the figures are represented, is the universal set U. Thus, the point which does not belong to any of the figures, belongs only to U.Pyramid Diagram
The Project Management Triangle Diagram depicts three main constraints of any project: scope, time and cost. Projects have to comply with the specified scope, projects should be finished in time and projects need to consume the budget. Each of the constraints represents one side of the triangle, and any change in budget or timing or scope affects the entire diagram. This diagram was made using ConceptDraw Office suite including best marketing project management software extended with collection of tools for creative project management software and project management reporting software symbols.Pyramid Diagram
The Time-Money-Quality Triangle illustrates an advertising truism, that you can't have all three.MS Visio Look a Like Diagrams
No need for any special drawing skills to create professional looking diagrams outside of your knowledge base. ConceptDraw DIAGRAM takes care of the technical details, allowing you to focus on your job, not the drawing. ConceptDraw DIAGRAM delivers full-functioned alternative to MS Visio. ConceptDraw DIAGRAM supports import of Visio files. ConceptDraw DIAGRAM supports flowcharting, swimlane, orgchart, project chart, mind map, decision tree, cause and effect, charts and graphs, and many other diagram types.Pyramid Diagram
A Venn-diagram style chart of the "project triangle" showing visually the potential overlaps between speed, quality and low cost, along with the "inability" to accomplish all three.Best Tool for Infographic Construction
ConceptDraw is a best data visualization tool that will allow everyone to create rich infographics and visualizations quickly and easily.Pyramid Diagram
The representation of data in a hierarchical or pyramid-like form is one of the most effective and illustrative ways of structuring the data, information, ideas in different fields, among them marketing, management, business, finances, sales, consulting, media, and some others. Pyramid Diagram perfectly suits for this goal, especially if we talk about the representing some marketing strategies, information systems, social strategies. Pyramid Diagram looks like a triangle or reversed triangle that is divided visually on several layers. Each layer can be colored with its own color, this lets visually highlight important moments. ConceptDraw DIAGRAM diagramming and vector graphics software extended with Pyramid Diagrams solution from the Marketing area provides powerful drawing tools, templates, samples, and built-in vector pyramid objects, thus all required tools for equally easy drawing Three level pyramid diagram, Four level pyramid model, Five level pyramid, etc., at this your Pyramid diagrams can have 2D or 3D view as you like.
Pyramid Diagrams
Pyramid Diagrams solution extends ConceptDraw DIAGRAM software with templates, samples and library of vector stencils for drawing the marketing pyramid diagrams.
- Knowledge - Venn diagram
- Knowledge - Venn diagram | Pyramid Diagram | Knowledge ...
- Knowledge - Venn diagram | Platos Diagram Of Knowledge
- Venn Diagram | Knowledge - Venn diagram | Venn Diagrams | Venn ...
- Knowledge - Venn diagram | Venn Diagram | Venn Diagram ...
- Knowledge - Venn diagram | Venn Diagram Examples for Problem ...
- Accounting Flowcharts | Venn Diagram | Elementary Knowledge Of ...
- Around The Knowledge Drawing With Conceptdraw Solution Park
- Venn Diagrams | Venn Diagram | How to Create a Venn Diagram in ...
- Graham's hierarchy of disagreement - Pyramid diagram | Venn ...
- Venn Diagram Template for Word | Venn Diagrams | Venn Diagram ...
- Venn Diagram Of Wisdom And Knowledge
- Graham's hierarchy of disagreement - Pyramid diagram | Venn ...
- The Information Knowledge Pyramid With Example
- The Diagram Of Knowledge Pyramid
- Venn Diagram | Venn Diagram Template for Word | Multi Layer Venn ...
- Venn Diagram Examples for Problem Solving. Computer Science ...
- Pyramid Diagram | Matrix Organization Structure | Pyramid Diagram ...
- Venn Diagram Examples for Problem Solving. Computer Science ...
- Venn Diagram Examples for Problem Solving. Venn Diagram as a ...
