 USA Maps
Use the USA Maps solution to create a map of USA, a US interstate map, printable US maps, US maps with cities and US maps with capitals. Create a complete USA states map.
IDEF0 standard with ConceptDraw PRO
The activity of any organization is more or less branchy network of processes. The description of these processes is a hard technical task which requires definite methodology and standards. According to the IDEF0 standard any process can be described in the form of a block (Activity Box) which has inputs and outputs. The process consists in transformation of inputs into outputs under the influence of the management and in the presence of necessary resources. Outputs of the given process later on can be either inputs for the next process or resources, or management means.
 Seven Basic Tools of Quality
Manage quality control in the workplace, using fishbone diagrams, flowcharts, Pareto charts and histograms, provided by the Seven Basic Tools of Quality solution.
Basic Flowchart Symbols and Meaning
Flowcharts are the best for visually representation the business processes and the flow of a custom-order process through various departments within an organization. ConceptDraw PRO diagramming and vector drawing software extended with Flowcharts solution offers the full set of predesigned basic flowchart symbols which are gathered at two libraries: Flowchart and Flowcharts Rapid Draw. Among them are: process, terminator, decision, data, document, display, manual loop, and many other specific symbols. The meaning for each symbol offered by ConceptDraw gives the presentation about their proposed use in professional Flowcharts for business and technical processes, software algorithms, well-developed structures of web sites, Workflow diagrams, Process flow diagram and correlation in developing on-line instructional projects or business process system. Use of ready flow chart symbols in diagrams is incredibly useful - you need simply drag desired from the libraries to your document and arrange them in required order. There are a few serious alternatives to Visio for Mac, one of them is ConceptDraw PRO. It is one of the main contender with the most similar features and capabilities.
HelpDesk
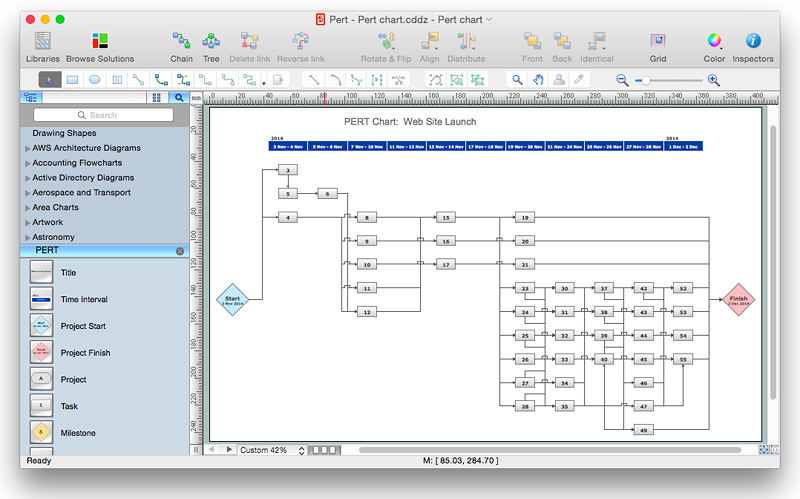
How to Create Project Diagrams on Mac
Diagrams are very useful for project implementation because they help teams visualize important details such as interrelations between tasks, critical paths, timelines, milestones, calendars, and also resource usage.HelpDesk
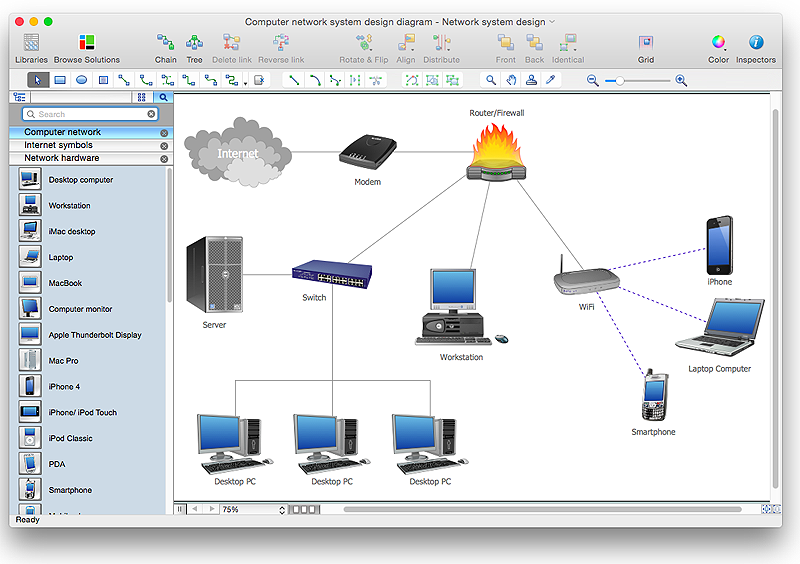
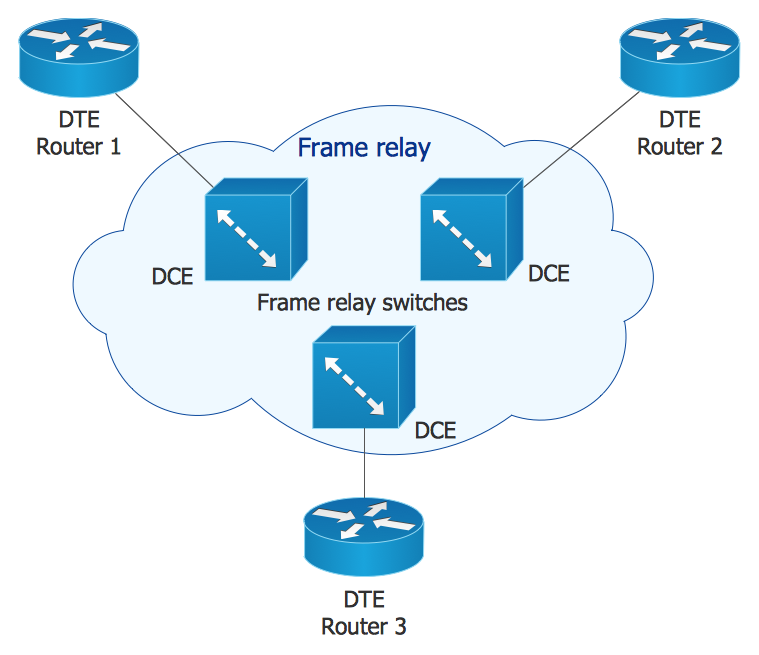
How to Create a Computer Network Diagram in ConceptDraw PRO
Computer Network diagram is intended to depict how a computer network is built and connected. It shows how data transfers between connections, and presents an overview of hardware and devices used. With the Conceptdraw solution for Computer Network Diagrams, system administrators, network architects and other related IT specialists have a perfect drawing tool that supplies adjective vector stencils representing hardware, telecom devices, and logical symbols that enhance possibilities in network diagramming, however complex the real network may be.HelpDesk
How to Draw a Block Diagram in ConceptDraw PRO
Block diagram is a simple chart that use blocks to show some elements or activities, and connectors that show the relationship between neighboring blocks. They are commonly simple, giving an overview of a process without necessarily going into the specifics of implementation. Block diagrams are commonly used to depict a general description of a system and its activity. A most known sample of a block diagram is a flow chart, used in many types of business as a common method of representing repeated processes. Easy and a simple creation, a number of objects and connectors make the block diagram a many-sided tool for various industries. The ability to make block diagrams is delivered by the ConceptDraw Block Diagrams solution.HelpDesk
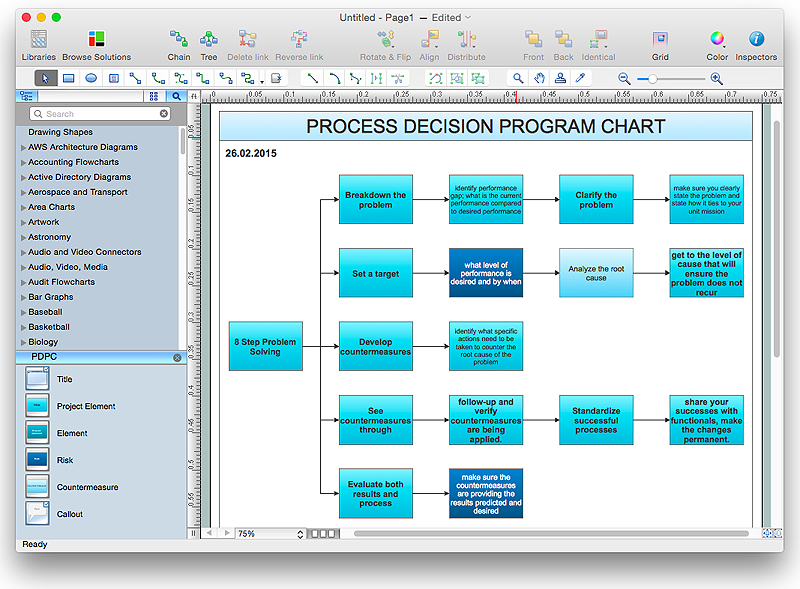
How To Create Risk Diagram (PDPC)
Article on how to identify possible risks when carrying out corrective actions, and define preventive actions
HelpDesk
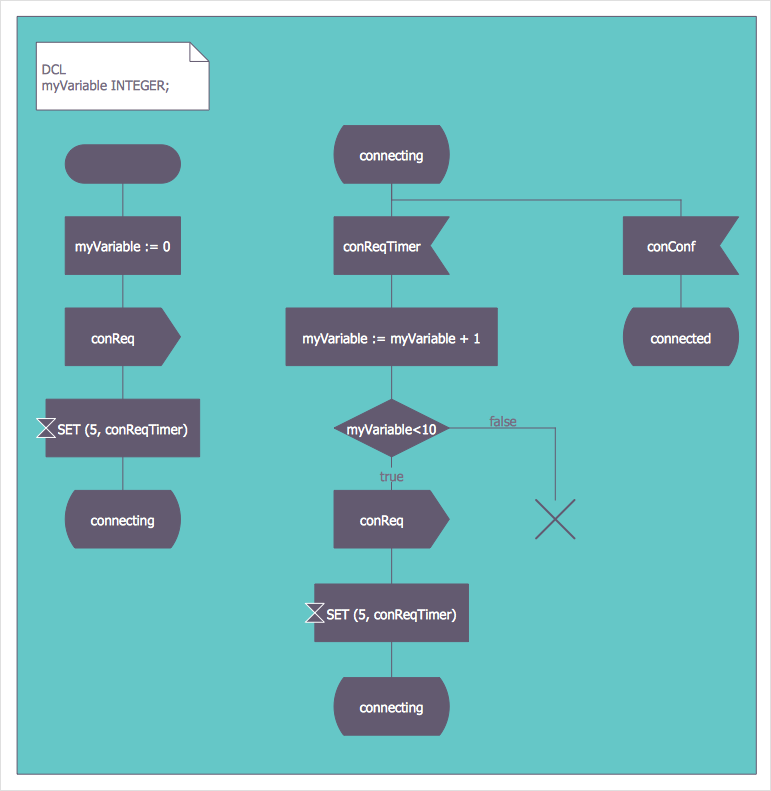
How to Create a SDL Diagram
Specification and Description Language (SDL) is intended to describe systems that switched state often and rapidly. An SDL diagram is a view of system, that can depict a single process, or complex relationships between a number of elements. The SDL diagram supports a nested hierarchy. A system is devided into blocks, each of them can be describes as a process, until finally one can see the initial procedures that make up each process. The advantage of this method is that a system can be viewed in manageable part thatcan be followed separately. ConceptDraw Specification and Description Language solution contains the library, with a SDL notation in a vector stencil graphics. The SDL solution also provides a set of samples, to show the level of hierarchical detail that is possible.HelpDesk
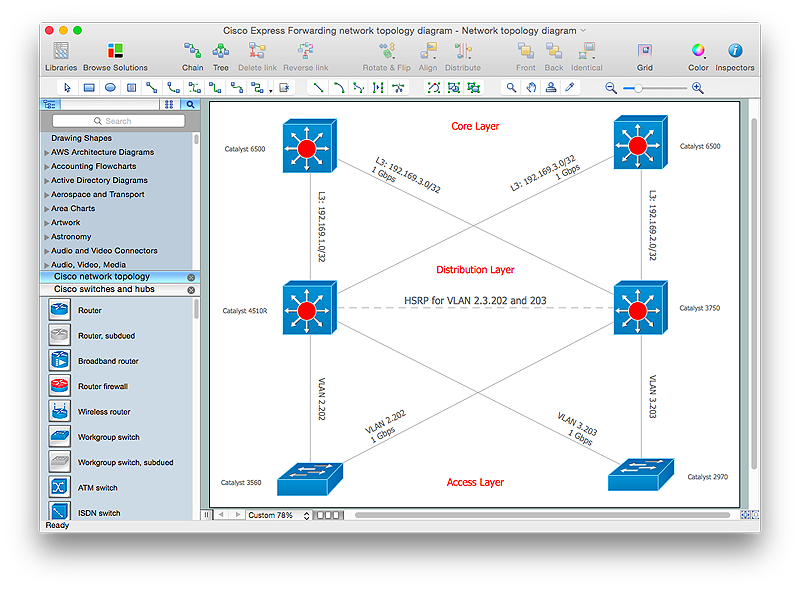
How to Create Cisco Network Diagrams
The easiest way to design Cisco Network diagram using standard Cisco product symbols is using ConceptDraw PRO powered by Cisco Network Diagrams solution. The Cisco Network Diagrams solution uses Cisco network symbols to to visually document the topology and design of Cisco networks.
 Divided Bar Diagrams
The Divided Bar Diagrams Solution extends the capabilities of ConceptDraw PRO v10 with templates, samples, and a library of vector stencils for drawing high impact and professional Divided Bar Diagrams and Graphs, Bar Diagram Math, and Stacked Graph.
HelpDesk
How to Create Cisco Network Diagram Using ConceptDraw Libraries
Cisco Network chart can be a great start for detailed network documentation, as well as serve as a visual instruction for new IT staff, or as a detailed illustration for a presentation. The easiest way to design Cisco Network diagram using standard Cisco product symbols is using ConceptDraw PRO powered by Cisco Network Diagrams solution. The Cisco Network Diagrams solution uses Cisco network symbols and icons to to visually document the Cisco network topology and design of Cisco network diagrams. Using ConceptDraw libraries you can access a wide array of Cisco network icons, so you can quickly prototype a new network or document an existing one.HelpDesk
How to Draw a Circular Arrows Diagram Using ConceptDraw PRO
The cyclic recurrence is a fundamental property of multiple systems. The cycle is a process which consists from elements (phases, stages, stages) following each other. Many processes in astronomy, biology, chemistry, physics, mathematics, etc. have a cycle properties. It is also widely used in information technologies and marketing analysis. Graphical representation of cyclic processes can have many forms. It can be a circle, parabola, hyperbola, ellipse and others. A Circular Arrows Diagram is used as one of the statistical charts in the business, mass media and marketing. ConceptDraw PRO provides its users tools for making easy drawing Circular Arrows Diagrams.HelpDesk
How to Create a Venn Diagram in ConceptDraw PRO
Venn diagrams were invented by John Venn as a method of depicting relationships between different components. A Venn diagram consists of two or more circles. Each circle represents a specific group or set. The entities which are depicted by circles generally have some common characteristics. A Venn Diagram shows all the possible logical relations between these entities. Any properties that belong to more than one set should be indicated in the sections where the circles overlap. A Venn Diagram can be useful to visually summarize the status and future viability of a project. ConceptDraw PRO allows you to make a Venn diagrams using the Venn Diagrams solution.HelpDesk
How to Draw a Gantt Chart Using ConceptDraw PRO
A Gantt chart is intended to provide a visualization of a project schedule. It is developed to help planning, coordinating, and tracking on project tasks implementation. One of the most critical resources for a project implementation is a time resources. Gantt chart - is one of the most convenient and popular way of graphical representation of a project tasks progress in conjunction with the corresponding time consumption. Gantt chart's function is to show project tasks completion in a progress, and to make a project manager sure that project tasks were completed on time. ConceptDraw Office is a clear and easy-to-use tool for project management. It is a very handy visual tool that helps make a project processing clear.- London election results - Divided bar diagram | 2012 United States ...
- London election results - Divided bar diagram | Bar Diagram Math ...
- Bar Diagram Math | USA Maps | Continent Maps | Prepare A Bar ...
- London election results - Divided bar diagram | Basic Flowchart ...
- Bar Diagram Math | Bargraph On 2016 Elections Results
- Basic Flowchart Images. Flowchart Examples | Donut Chart ...
- Result Analysis Diagram Service Industry
- Photooxygenation - Venn diagram
- Fishbone diagram - Bad coffee | Fishbone Diagrams | Fishbone ...
- Basic Flowchart Images. Flowchart Examples | Data Flow Diagrams ...
- Step Area Graph | US incarceration timeline-clean - Area graph | US ...
- Data flow Model Diagram
- London election results | Bar Diagram Math | Divided Bar Diagrams ...
- Design elements - Stratification diagram | Stratification diagram ...
- Organizational chart - United States Department of Labor | Bar ...
- Online Result Software Diagram
- Network diagrams with ConceptDraw PRO | Interactive Voice ...
- Process Flowchart | Cross-functional flowchart landscape, U.S. units ...
- Growth Cycle Diagram
- Data Flow Diagram


