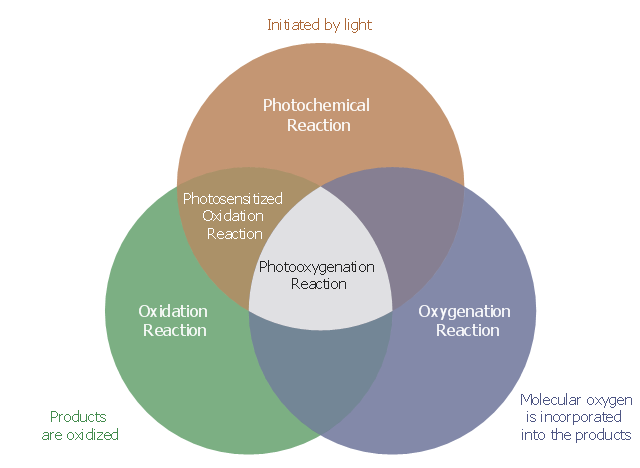
A Venn diagram differentiating between photochemical/ oxidation terminology.
This Venn diagram example was redesigned from the Wikimedia Commons file: Photooxygenation venn diagram.svg.
This file is licensed under the Creative Commons Attribution 3.0 Unported license.
[creativecommons.org/ licenses/ by/ 3.0/ deed.en]
"A photooxygenation is a light-induced oxidation reaction in which molecular oxygen is incorporated into the product(s). ... Early studies of photooxygenation focused on oxidative damage to DNA and amino acids, but recent research has led to the application of photooxygenation in organic synthesis and photodynamic therapy.
Photooxygenation reactions are initiated by a photosensitizer, which is a molecule that enters an excited state when exposed to light of a specific wavelength (e.g. dyes and pigments). The excited sensitizer then reacts with either a substrate or ground state molecular oxygen, starting a cascade of energy transfers that ultimately result in an oxygenated molecule. Consequently, photooxygenation reactions are categorized by the type and order of these intermediates (as type I, type II, or type III reactions). ...
Photooxygenation reactions are easily confused with a number of processes baring similar names (i.e. photosensitized oxidation). Clear distinctions can be made based on three attributes: oxidation, the involvement of light, and the incorporation of molecular oxygen into the products" [Photooxygenation. Wikipedia]
The Venn diagram example "Photooxygenation" was created using the ConceptDraw PRO diagramming and vector drawing software extended with the Venn Diagrams solution from the area "What is a Diagram" of ConceptDraw Solution Park.
Venn diagram
 Venn Diagrams
Venn Diagrams are actively used to illustrate simple set relationships in set theory and probability theory, logic and statistics, mathematics and computer science, linguistics, sociology, and marketing. Venn Diagrams are also often used to visually summarize the status and future viability of a project.
Venn Diagram Maker

Venn Diagram Examples
