Draw Flowcharts with ConceptDraw

Use the Best FlowChart Tool for the Job

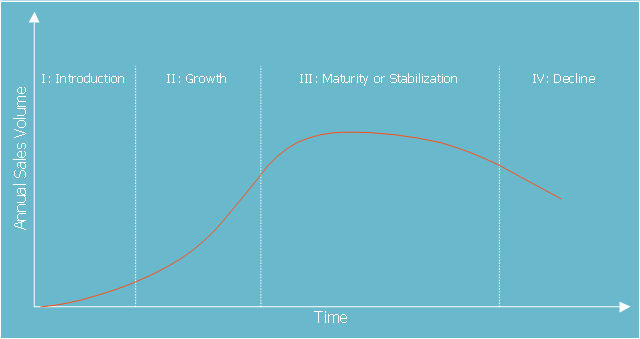
This marketing chart sample represents product life cycle. It was designed on the base of the Wikimedia Commons file: Product life-cycle curve.jpg. [commons.wikimedia.org/ wiki/ File:Product_ life-cycle_ curve.jpg]
This file is licensed under the Creative Commons Attribution-Share Alike 4.0 International license. [creativecommons.org/ licenses/ by-sa/ 4.0/ deed.en]
The marketing chart example "Product life cycle graph" was created using the ConceptDraw PRO diagramming and vector drawing software extended with the Marketing Diagrams solution from the Marketing area of ConceptDraw Solution Park.
Marketing chart
Waterfall Bar Chart

 Circular Arrows Diagrams
Circular Arrows Diagrams solution extends ConceptDraw PRO v10 with extensive drawing tools, predesigned samples, Circular flow diagram template for quick start, and a library of ready circular arrow vector stencils for drawing Circular Arrow Diagrams, Segmented Cycle Diagrams, and Circular Flow Diagrams. The elements in this solution help managers, analysts, business advisers, marketing experts, scientists, lecturers, and other knowledge workers in their daily work.
Line Chart Examples

Bar Diagrams for Problem Solving. Create manufacturing and economics bar charts with Bar Graphs Solution

Growth-Share Matrix Software

Bar Diagrams for Problem Solving. Create event management bar charts with Bar Graphs Solution

Bar Graph

- Product life cycle graph | Draw Flowcharts with ConceptDraw ...
- Product life cycle graph
- Product life cycle process - Flowchart | With The Aid Of Diagram ...
- Product life cycle graph
- Product Life Cycle Diagram Marketing
- Product Life Cycle Diagram
- Product Life Cycle Chart
- Product life cycle graph | Draw Flowcharts with ConceptDraw ...
- Life Cycle Marketing Diagram
- Product life cycle graph - Template