Fault Tree Analysis Software
ConceptDraw PRO extended with Fault Tree Analysis Diagrams Solution from the Engineering Area of ConceptDraw Solution Park is the best Fault Tree Analysis Software. First of all, Fault Tree Analysis Diagrams Solution provides a set of samples which are the good examples of easy drawing professional looking Fault Tree Analysis Diagrams.CORRECTIVE ACTIONS PLANNING. Risk Diagram (PDPC)
Risk Diagram (PDPC) - ConceptDraw Office suite is a software for Risks Diagram making. This diagram identifies possible risks in accomplishing corrective actions. With the Risks Diagram, one analyzes each action separately in a tree of all actions and develops a preventive action in response of each potential obstacles or circumstances which may be a risk.
Using Fishbone Diagrams for Problem Solving
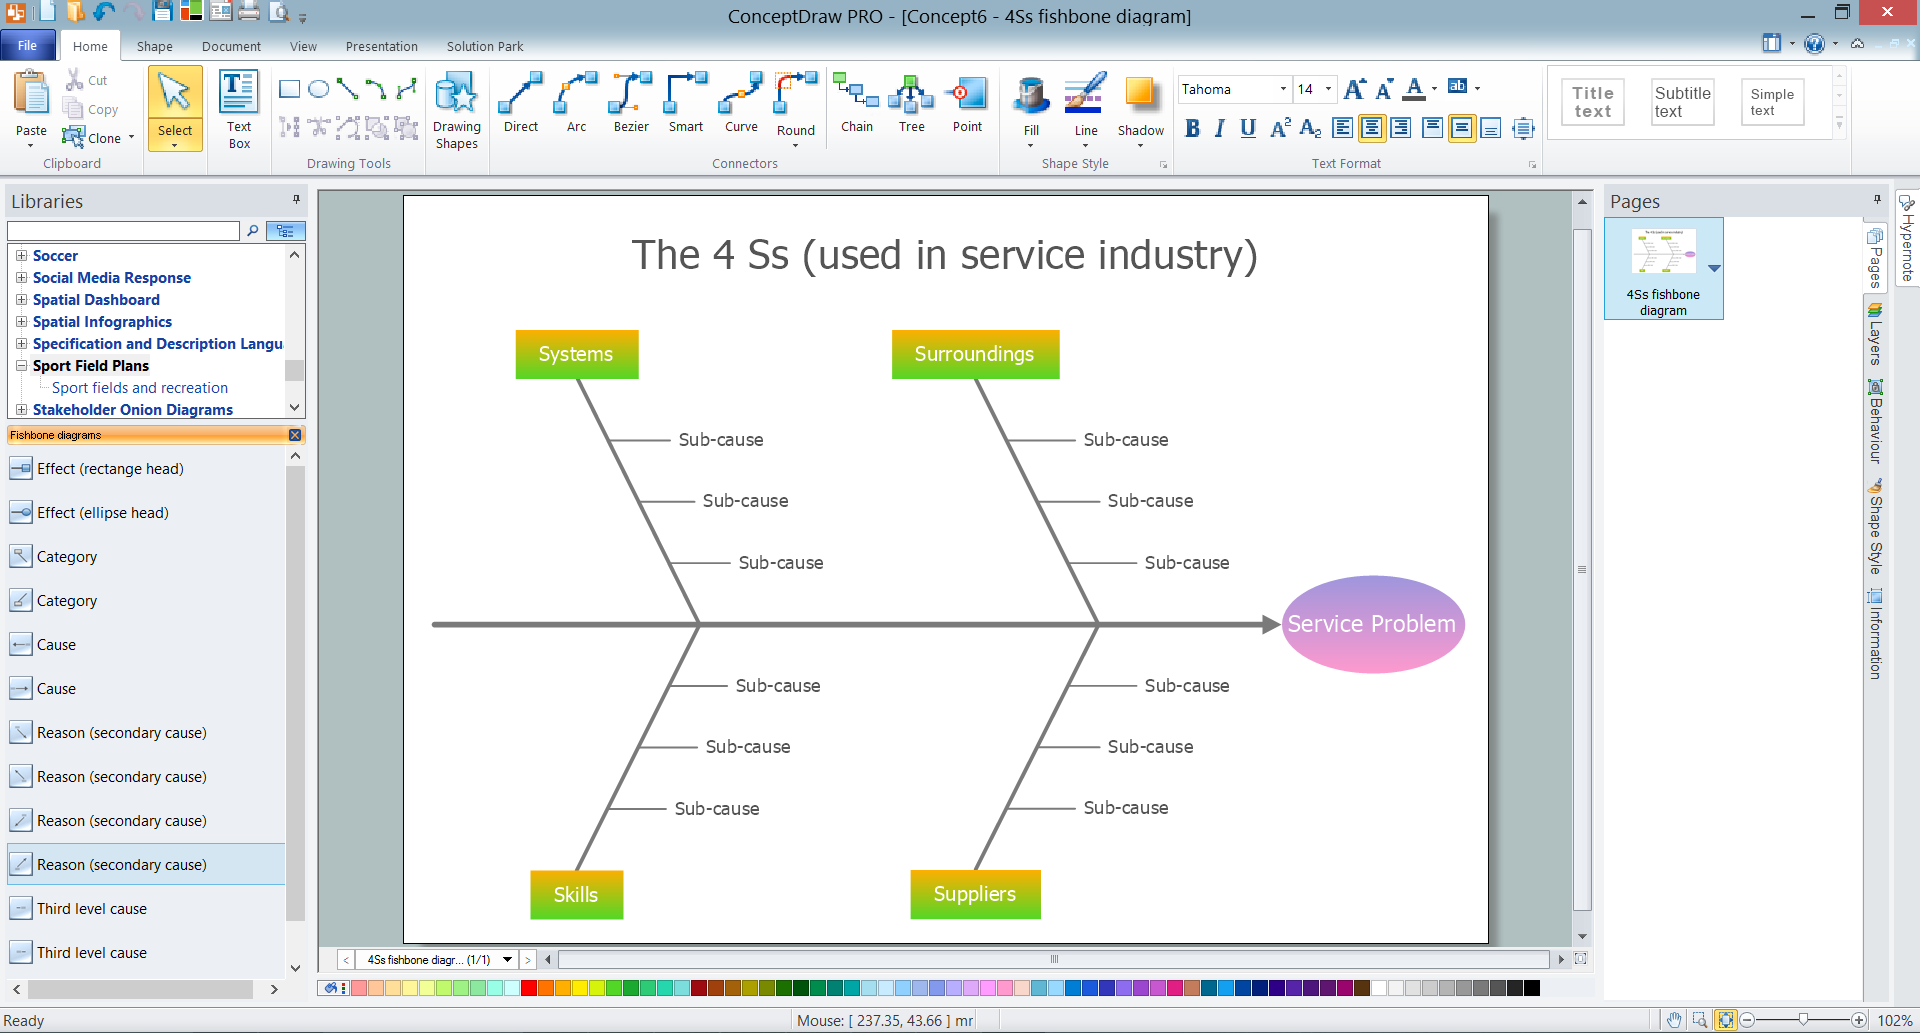
Problems are obstacles and challenges that one should overcome to reach the goal. They are an inseparable part of any business, and the success of an enterprise often depends on ability to solve all problems effectively. The process of problem solving often uses rational approach, helping to find a suitable solution. Using Fishbone Diagrams for Problem Solving is a productive and illustrative tool to identify the most important factors causing the trouble. ConceptDraw PRO extended with Fishbone Diagrams solution from the Management area of ConceptDraw Solution Park is a powerful tool for problem solving with Fishbone Ishikawa diagram graphic method.Fishbone Diagram Problem Solving
The Ishikawa diagram, Cause and Effect diagram, Fishbone diagram — all they are the names of one and the same visual method for working with causal connections. Originally invented by Kaoru Ishikawa to control the process quality, the Ishikawa diagram is well proven in other fields of management and personal scheduling, events planning, time management. It is a chart in the form of a fish, whose head is a problem, the fins are variants for its causes. To design easily the Fishbone diagram, you can use a special ConceptDraw PRO vector graphic and diagramming software which contains the powerful tools for Fishbone diagram problem solving offered by Fishbone Diagrams solution for the Management area of ConceptDraw Solution Park.Cause and Effect Analysis - Fishbone Diagrams for Problem Solving
Fishbone diagram is a powerful tool used for solving business problems and obstacles. ConceptDraw PRO software extended with Fishbone Diagrams solution from the Management area of ConceptDraw Solution Park is a helpful tool for cause and effect analysis. It gives the ability to easy identify many possible causes and factors which cause the effects and to draw Fishbone Diagrams for problem solving.Fishbone Problem Solving Tool
Fishbone diagram, often reffered as Cause and Effect diagram or Ishikawa diagram, is one of the basic and the most effective tools for problems solving. It is a way of graphical identifying, structuring and exploration the root causes of a problem for determining effective decision. ConceptDraw PRO enhanced with Fishbone Diagrams solution is a professional fishbone problem solving tool which helps you draw Business Productivity diagram, Cause and Effect, Fishbone, Ishikawa Diagrams to solve problems at your business.
 Fishbone Diagrams
The Fishbone Diagrams solution extends ConceptDraw PRO v10 software with the ability to easily draw the Fishbone Diagrams (Ishikawa Diagrams) to clearly see the cause and effect analysis and also problem solving. The vector graphic diagrams produced using this solution can be used in whitepapers, presentations, datasheets, posters, and published technical material.
CORRECTIVE ACTIONS PLANNING. Involvement Matrix
The Involvement Matrix can identify the distribution of responsibilities and identify roles in a group or team. Use the Involvement Matrix to specify roles and responsibilities of actions in problem solving. ConceptDraw Office suite is a software for corrective actions planning.
 Fishbone Diagram
Fishbone Diagrams solution extends ConceptDraw PRO software with templates, samples and library of vector stencils for drawing the Ishikawa diagrams for cause and effect analysis.
Business Board Org Chart
This sample was created in ConceptDraw PRO diagramming and vector drawing software using the Organizational Charts Solution from the Software Development area of ConceptDraw Solution Park. This sample shows the organizational chart in the field of Architect Engineering. Create your own orgchart professional drawings using ConceptDraw.Chemical Engineering
ConceptDraw PRO is a powerful diagramming and vector drawing software. Extended with Chemical and Process Engineering Solution from the Engineering Area of ConceptDraw Solution Park, it became the best Chemical Engineering software.- Tree Diagram For Factors Of Production
- PROBLEM ANALYSIS. Root Cause Analysis Tree Diagram ...
- PROBLEM ANALYSIS. Root Cause Analysis Tree Diagram | Cause ...
- PROBLEM ANALYSIS. Root Cause Analysis Tree Diagram | How to ...
- PROBLEM ANALYSIS. Root Cause Analysis Tree Diagram | How to ...
- Cause and Effect Analysis | Cause and Effect Diagram Software ...
- Manufacturing 8 Ms fishbone diagram - Template | How Do ...
- Fault Tree Analysis Diagrams
- Manufacturing 8 Ms fishbone diagram - Template | How Do ...
- Draw A Tree Diagram Showing The Functional Organization Of A
- Best Software For Tree Diagram
- Production Managment Dayigram
- Manufacturing 8 Ms fishbone diagram - Template | Fishbone ...
- Corporate Tree Diagram
- Business Tree Flow Chart
- PROBLEM ANALYSIS. Root Cause Analysis Tree Diagram | TQM ...
- 5-Set Venn diagram - Template | Context Diagram Template | Root ...
- Tree Chart Creator
- Production Planning Diagram


